E-mini S&P 500 Index (ES) Futures Technical Analysis – Dovish Minutes Could Spike Index Higher
March E-mini S&P 500 Index futures are trading flat early Wednesday. Although the index finished higher on Tuesday, the trade throughout most of the session was lackluster due to worries over the lack of progress in the trade talks between the United States and China, and position-squaring ahead of the release of the U.S. Federal Reserve’s January Monetary Policy Minutes at 19:00 GMT.
At 06:17 GMT, March E-mini S&P 500 Index futures are trading 2778.50, down 0.25 or -0.01%.
We expect to see heightened volatility with the release of the minutes. Traders will be looking for comments on the Federal Reserve’s balance sheet.
Daily Swing Chart Technical Analysis
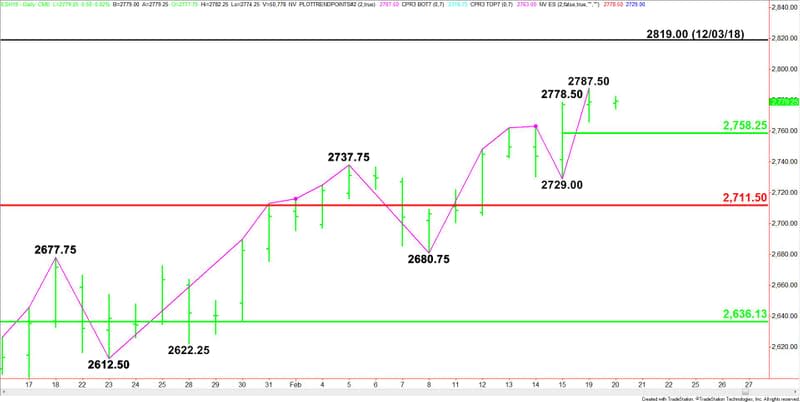
The main trend is up according to the daily swing chart. A trade through 2787.50 will signal a resumption of the uptrend. A move through 2729.00 will change the main trend to down.
The short-term range is 2729.00 to 2787.50. Its 50% level or pivot is 2758.25. This is minor support.
The major support is the Fibonacci level at 2711.50.
Daily Swing Chart Technical Forecast
Based on the early price action, the direction of the March E-mini S&P 500 Index on Wednesday is likely to be determined by trader reaction to yesterday’s high at 2787.50.
Bullish Scenario
A sustained move over 2787.50 will indicate the presence of buyers. If this move is able to create enough upside momentum then look for a potential drive into the December 3 main top at 2819.00.
Bearish Scenario
A sustained move under 2787.50 will signal the presence of sellers. The first target is the 50% level or pivot at 2758.25. Look for a technical bounce on the first test of this level. If it fails then look for the selling to possibly extend into the main bottom at 2729.00.
The main trend will change to down on a trade through 2729.00. This could trigger a further break into the Fibonacci level at 2711.50.
Closing Price Reversal Top Scenario
Taking out 2787.50 then turning lower for the session will indicate the presence of sellers. This will also put the index in a position to form a potentially bearish closing price reversal top. This chart pattern will not indicate a change in trend, but it could trigger the start of a 2 to 3 day counter-trend correction.
This article was originally posted on FX Empire
More From FXEMPIRE:
GBP/USD Price Forecast – British Pound Range Bound Ahead of Update From Brussels
E-mini S&P 500 Index (ES) Futures Technical Analysis – Dovish Minutes Could Spike Index Higher
Bitcoin Cash – ABC, Litecoin and Ripple Daily Analysis – 20/02/19
Bitcoin – Holds onto $4,000 Levels as the Bulls Search for More
AUD/USD Forex Technical Analysis – February 20, 2019 Forecast
