E-mini S&P 500 Index (ES) Futures Technical Analysis – Major Downside Target is 3204.25 to 3172.75
Fear of the spread of the coronavirus is driving investors out of higher risk assets on Monday, driving the March E-mini S&P 500 Index sharply lower. The price action indicates today will be a risk-off session. Furthermore, with the disease spreading and authorities unable to get control of the situation, the downside momentum created by the news could eventually lead to a change in trend.
At 11:05 GMT, March E-mini S&P 500 Index futures are trading 3239.25, down 54.25 or -1.65%.
Daily Technical Analysis
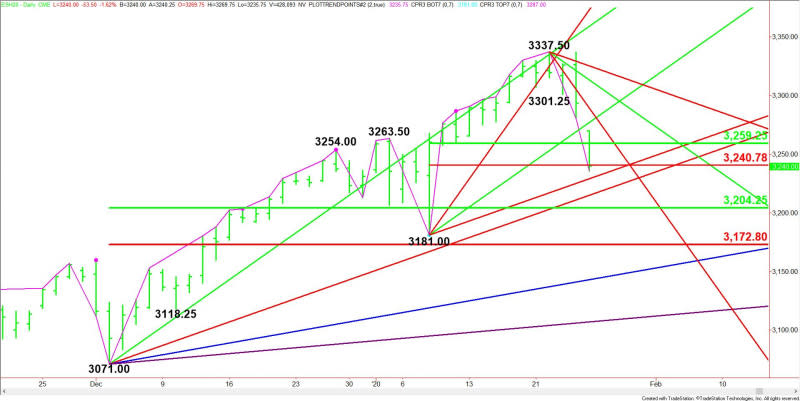
The main trend is up according to the daily swing chart. However, momentum is trending lower. The main trend will change to down on a trade through 3181.00. A move through 3337.50 will signal a resumption of the uptrend.
The minor trend is down. It turned down on Friday, leading to the shift in momentum.
The short-term range is 3181.00 to 3337.50. Its retracement zone at 3259.25 to 3240.75 is controlling the near-term direction of the index.
The main range is 3071.00 to 3337.50. Its retracement zone at 3204.25 to 3172.75 is the primary downside target. We could see a technical bounce on the first test of this zone, but if it fails then look out to the downside.
Daily Technical Forecast
Based on the early price action and the current price at 3239.25, the direction of the March E-mini S&P 500 Index the rest of the session on Monday is likely to be determined by trader reaction to the short-term Fibonacci level at 3240.75.
Bearish Scenario
A sustained move under 3240.75 will indicate the selling is getting stronger. This could trigger a break into a pair of uptrending Gann angles at 3229.00 and 3215.00. Watch for a technical bounce on the first test of these angles.
Taking out 3215.00 could trigger a break into the main 50% level at 3204.25. If this fails then look for a move into the main bottom at 3181.00 and the main Fibonacci level at 3172.75.
Taking out 3172.75 will put the index in an extremely bearish position with target angles coming in at 3143.00 and 3107.00. The latter is the last potential support angle before the 3071.00 main bottom.
Bullish Scenario
A sustained move over 3240.75 will signal the presence of buyers. This could trigger a rally into the short-term 50% level at 3259.25, followed by a resistance cluster at 3277.00 to 3289.50.
This article was originally posted on FX Empire
More From FXEMPIRE:
AUD/USD Price Forecast – Australian Dollar Gapped Lower To Kick Off The Week
Wuhan Virus Spreads, Global Markets Fall, Earnings Season Hits Peak
EUR/USD Price Forecast – Euro Looking For Support At Major Level
Gold Price Futures (GC) Technical Analysis – Strengthens Over $1590.30, Weakens Under $1581.20
A Coronavirus that Will Test China’s Ability to Comply with the Trade Agreement…
