E-mini S&P 500 Index (ES) Futures Technical Analysis – 2748.50 Controlling Weekly Direction, 2818.00 Most Important Level for Bulls
December E-mini S&P 500 Index futures finished lower last week, but the index did close above the mid-point of the week. This suggests a slight shift to the upside in momentum that could carry over into next week’s holiday-shortened week.
A weak technology sector weighed on prices all week but dovish talk about future rate hikes from the 2nd ranking Fed official on Friday could be positive news for stocks.
For the week, December E-mini S&P 500 Index futures settled at 2743.00, down 36.00 or -1.30%.
Weekly Swing Chart Technical Analysis
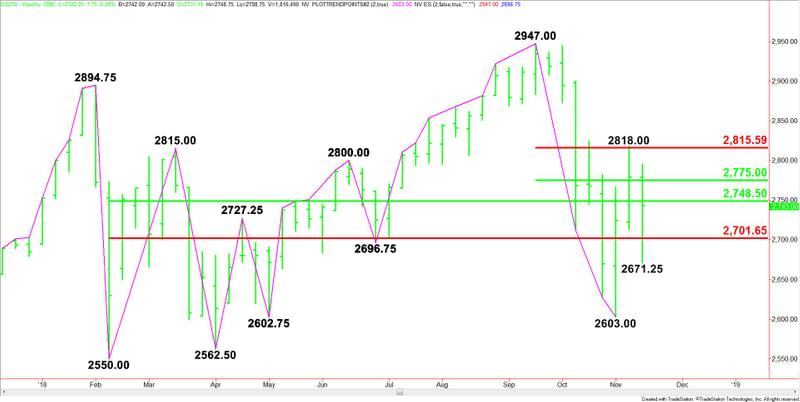
The main trend is down according to the weekly swing chart. A trade through 2603.00 will signal a resumption of the downtrend. This could trigger a break into the nearest main bottoms at 2602.75, 2562.50 and 2550.00.
The main trend will change to up on a move through 2647.00. This is the nearest main top.
The minor trend is also down. A trade through 2818.00 will change the minor trend to up. This will also shift momentum to the upside. This is the most important level on the chart for bullish traders.
Weekly Retracement Level Technical Analysis
There are two retracement zones to watch. The market has been straddling these levels for six weeks. They are controlling the price action.
The main range is 2550.00 to 2947.00. Its retracement zone is 2748.50 to 2701.50. Last week, the market started on the bullish side of this zone then crossed to the bearish side of this zone before settling just under the top of the zone.
The short-term range is 2947.00 to 2603.00. Its retracement zone is 2775.00 to 2815.50. This zone stopped the rally the week-ending November 9 and it provided resistance last week.

Weekly Swing Chart Technical Forecast
Based on last week’s price action and the close at 2743.00, the direction of the December E-mini S&P 500 Index this week is likely to be determined by trader reaction to the major 50% level at 2748.50.
Bullish Scenario
Overtaking and sustaining a move over 2748.50 will indicate the presence of buyers. The first target is the short-term 50% level at 2775.00. Since the main trend is down, sellers are likely to come in on a test of this level. Overtaking it, however, could fuel a rally into the short-term Fibonacci level at 2815.50, followed closely by the minor top at 2818.00.
The trigger point for an acceleration to the upside this week is 2818.00.
Bearish Scenario
A sustained move under 2748.50 will signal the presence of sellers. The first target is the Fibonacci level at 2701.50. If sellers can press the index hard under this level then look for last week’s low at 2671.25 to fail.
Taking out 2671.25 with conviction could drive the index into 2603.00 to 2602.75.
Basically, we’re looking for an upside bias to develop on a sustained move over 2748.50 and for the downside bias to resume on a sustained move under 2701.50.
This article was originally posted on FX Empire
More From FXEMPIRE:
S&P 500 Weekly Price Forecast – stock markets continue to look rough
AUD/USD Forex Technical Analysis – Main Trend Changed to Up on Weekly Chart
USD/JPY Weekly Price Forecast – US dollar falls against Japanese yen for the week
AUD/USD Weekly Price Forecast – Australian dollar finds buyers for the week
