E-mini S&P 500 Index (ES) Futures Technical Analysis – Vertical Rise Makes It Vulnerable to Reversal Top
December E-mini S&P 500 Index futures are trading higher late in the session on Wednesday after the cash market close as investors celebrated better than expected third-quarter earnings from U.S. companies. The benchmark index is currently trading within striking distance of its all-time high recorded in early September.
At 10:32 GMT, December E-mini S&P 500 Index futures are trading 4524.50, up 13.25 or +0.29%.
With just about 14% of S&P 500 third-quarter reports in, analysts were expecting earnings for the benchmark index to rise 33% from the year-ago quarter. More than 85% of those who reported beat expectations, according to the latest data from Refinitiv.
Daily Swing Chart Technical Analysis
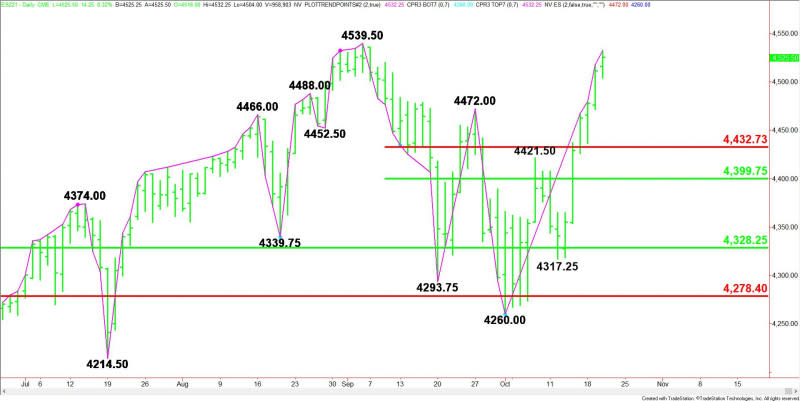
The main trend is up according to the daily swing chart. A trade through the intraday high at 4532.25 will signal a resumption of the uptrend. A move through 4539.50 will reaffirm the uptrend.
The main trend will change to down on a trade through the nearest main bottom at 4260.00. This is highly unlikely but due to the prolonged move up in terms of price and time, today’s session will end with the index inside the window of time for a closing price reversal top.
A closing price reversal top won’t change the trend to down, but if confirmed, it could trigger the start of a minimum 2 to 3 day pullback or 50% correction of the current rally.
The short-term range is 4539.50 to 4260.00. The index is trading on the strong side of its retracement zone at 4432.75 to 4399.75, making it new support.
Daily Swing Chart Technical Forecast
The late session momentum suggests there will be follow-through buying during Thursday’s pre-market session. The market is close enough to the all-time high at 4539.50 that traders should take a shot at it early in the session.
There is some risk to the downside, however, because of the 14 to 20 day cycle. During this time period, we could see a higher-high, lower close. If the index takes out the previous day’s high and especially the record top then is going to have to remain positive for the session.
Turning lower for the day will be an early sign that the selling is greater than the buying at current price levels.
For a look at all of today’s economic events, check out our economic calendar.
This article was originally posted on FX Empire
