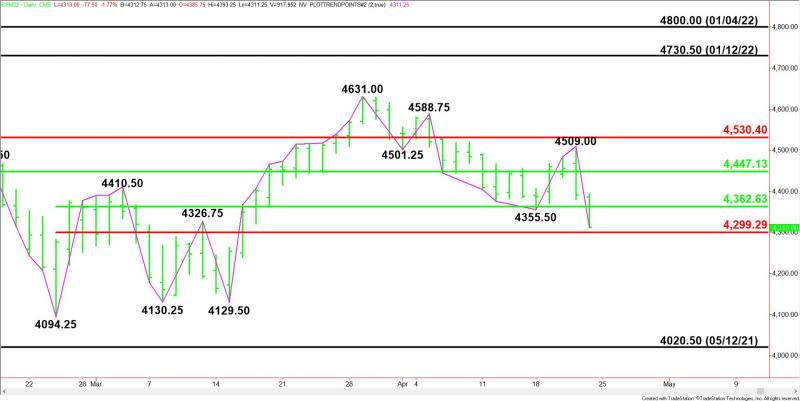
E-mini S&P: Selling Could Accelerate if 4299.25 Fails
June E-mini S&P 500 Index futures are trading sharply lower at the mid-session on Friday after some weak earnings reports, with growth stocks coming under pressure in a torrid week that saw bond yields surge on expectations of interest rate hikes.
At 16:01 GMT, June E-mini S&P 500 Index futures are trading 4310.25, down 80.25 or -1.83%. The S&P 500 Trust ETF (SPY) is at $430.17, down $7.89 or -1.80%.
All the 11 major S&P 500 sectors fell, with healthcare stocks dropping the most after a downbeat profit forecast from HCA Healthcare sent its shares tumbling 16.7%.
Of the 99 companies in the S&P 500 that have reported earnings for the first quarter, 77.8% of them have beat market expectations. Typically, 66% of companies beat estimates, according to Refinitiv data.
In economic news, U.S. business activity slowed in April as soaring costs for raw materials, fuel and labor pushed input prices to a record high, according to a survey by S&P Global.

Daily Swing Chart Technical Analysis
The main trend is down according to the daily swing chart. The downtrend was reaffirmed when sellers took out the last main bottom at 4355.50. A trade through 4509.00 will change the main trend to up.
The short-term range is 4094.25 to 4631.00. The index is currently testing its retracement zone at 4362.75 to 4299.25. This zone is controlling the near-term direction of the index.
The main range is 4800.00 to 4094.25. Its retracement zone at 4447.25 to 4530.50 is resistance.
Daily Swing Chart Technical Forecast
The direction of the June E-mini S&P 500 Index into the close on Friday is likely to be determined by trader reaction to 4299.25.
Bearish Scenario
A sustained move under 4299.25 will indicate the presence of sellers. This move can trigger an acceleration to the downside since the next major target doesn’t come in until 4129.50.
Bullish Scenario
A sustained move over 4299.25 will signal the presence of buyers. If this move creates enough upside momentum then look for a late session surge into the short-term 50% level at 4362.75. Overtaking this level will indicate the buying is getting stronger. This could lead to a test of 4390.50. Taking out this level will turn the market higher for the day.
For a look at all of today’s economic events, check out our economic calendar.
This article was originally posted on FX Empire
