Earnings are growing at Western Union (NYSE:WU) but shareholders still don't like its prospects
Passive investing in an index fund is a good way to ensure your own returns roughly match the overall market. Active investors aim to buy stocks that vastly outperform the market - but in the process, they risk under-performance. That downside risk was realized by The Western Union Company (NYSE:WU) shareholders over the last year, as the share price declined 31%. That falls noticeably short of the market decline of around 6.7%. However, the longer term returns haven't been so bad, with the stock down 9.6% in the last three years. The last week also saw the share price slip down another 9.4%.
Since Western Union has shed US$699m from its value in the past 7 days, let's see if the longer term decline has been driven by the business' economics.
See our latest analysis for Western Union
To paraphrase Benjamin Graham: Over the short term the market is a voting machine, but over the long term it's a weighing machine. One imperfect but simple way to consider how the market perception of a company has shifted is to compare the change in the earnings per share (EPS) with the share price movement.
During the unfortunate twelve months during which the Western Union share price fell, it actually saw its earnings per share (EPS) improve by 25%. It could be that the share price was previously over-hyped.
The divergence between the EPS and the share price is quite notable, during the year. But we might find some different metrics explain the share price movements better.
Western Union's dividend seems healthy to us, so we doubt that the yield is a concern for the market. From what we can see, revenue is pretty flat, so that doesn't really explain the share price drop. Of course, it could simply be that it simply fell short of the market consensus expectations.
The company's revenue and earnings (over time) are depicted in the image below (click to see the exact numbers).
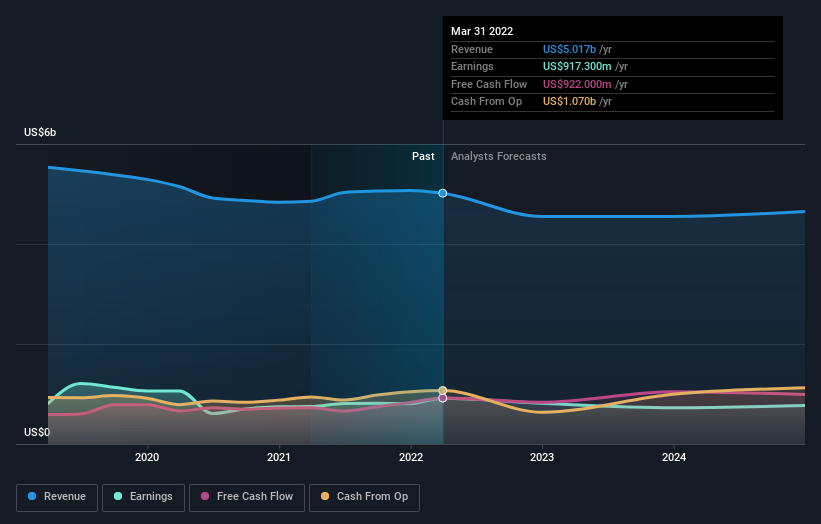
Western Union is a well known stock, with plenty of analyst coverage, suggesting some visibility into future growth. Given we have quite a good number of analyst forecasts, it might be well worth checking out this free chart depicting consensus estimates.
What About Dividends?
It is important to consider the total shareholder return, as well as the share price return, for any given stock. The TSR is a return calculation that accounts for the value of cash dividends (assuming that any dividend received was reinvested) and the calculated value of any discounted capital raisings and spin-offs. It's fair to say that the TSR gives a more complete picture for stocks that pay a dividend. We note that for Western Union the TSR over the last 1 year was -28%, which is better than the share price return mentioned above. This is largely a result of its dividend payments!
A Different Perspective
While the broader market lost about 6.7% in the twelve months, Western Union shareholders did even worse, losing 28% (even including dividends). However, it could simply be that the share price has been impacted by broader market jitters. It might be worth keeping an eye on the fundamentals, in case there's a good opportunity. On the bright side, long term shareholders have made money, with a gain of 1.7% per year over half a decade. If the fundamental data continues to indicate long term sustainable growth, the current sell-off could be an opportunity worth considering. It's always interesting to track share price performance over the longer term. But to understand Western Union better, we need to consider many other factors. Even so, be aware that Western Union is showing 2 warning signs in our investment analysis , and 1 of those is a bit unpleasant...
But note: Western Union may not be the best stock to buy. So take a peek at this free list of interesting companies with past earnings growth (and further growth forecast).
Please note, the market returns quoted in this article reflect the market weighted average returns of stocks that currently trade on US exchanges.
Have feedback on this article? Concerned about the content? Get in touch with us directly. Alternatively, email editorial-team (at) simplywallst.com.
This article by Simply Wall St is general in nature. We provide commentary based on historical data and analyst forecasts only using an unbiased methodology and our articles are not intended to be financial advice. It does not constitute a recommendation to buy or sell any stock, and does not take account of your objectives, or your financial situation. We aim to bring you long-term focused analysis driven by fundamental data. Note that our analysis may not factor in the latest price-sensitive company announcements or qualitative material. Simply Wall St has no position in any stocks mentioned.
