Are Earnings Prospects Improving For Loss-Making Quality & Reliability AB.E.E’s (ATH:QUAL)?

Examining Quality & Reliability AB.E.E’s (ATSE:QUAL) past track record of performance is a useful exercise for investors. It allows us to reflect on whether the company has met or exceed expectations, which is a powerful signal for future performance. Below, I will assess QUAL’s latest performance announced on 30 June 2017 and weight these figures against its longer term trend and industry movements. See our latest analysis for Quality & ReliabilityE.E
Did QUAL beat its long-term earnings growth trend and its industry?
For the purpose of this commentary, I like to use data from the most recent 12 months, which annualizes the most recent half-year data, or in some cases, the latest annual report is already the most recent financial year data. This technique allows me to examine different companies on a similar basis, using the latest information. For Quality & ReliabilityE.E, its most recent earnings (trailing twelve month) is -€380.54K, which compared to the prior year’s level, has become less negative. Given that these values are somewhat myopic, I’ve estimated an annualized five-year value for QUAL’s net income, which stands at -€733.91K. This means that, while net income is negative, it has become less negative over the years.
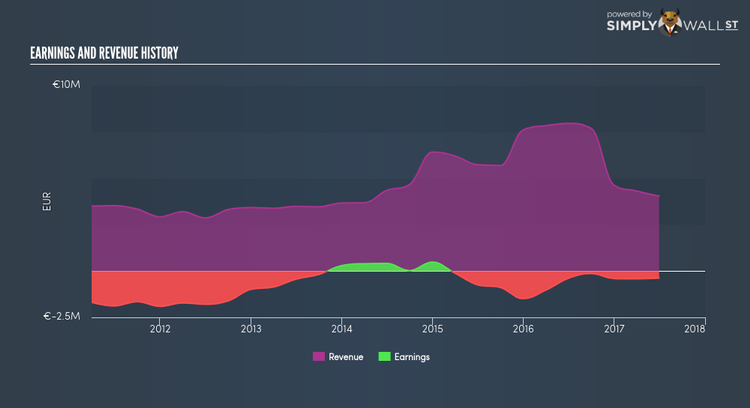
We can further examine Quality & ReliabilityE.E’s loss by looking at what the industry has been experiencing over the past few years. Each year, for the past half a decade Quality & ReliabilityE.E’s top-line has grown by 13.05% on average, signalling that the company is in a high-growth period with expenses shooting ahead of revenues, leading to annual losses. Looking at growth from a sector-level, the GR it industry has been growing its average earnings by double-digit 23.78% in the prior year, and 29.05% over the past five. This means whatever tailwind the industry is profiting from, Quality & ReliabilityE.E has not been able to reap as much as its average peer.
What does this mean?
Though Quality & ReliabilityE.E’s past data is helpful, it is only one aspect of my investment thesis. Companies that incur net loss is always difficult to envisage what will occur going forward, and when. The most valuable step is to assess company-specific issues Quality & ReliabilityE.E may be facing and whether management guidance has consistently been met in the past. I suggest you continue to research Quality & ReliabilityE.E to get a more holistic view of the stock by looking at:
1. Financial Health: Is QUAL’s operations financially sustainable? Balance sheets can be hard to analyze, which is why we’ve done it for you. Check out our financial health checks here.
2. Valuation: What is QUAL worth today? Is the stock undervalued, even when its growth outlook is factored into its intrinsic value? The intrinsic value infographic in our free research report helps visualize whether QUAL is currently mispriced by the market.
3. Other High-Performing Stocks: Are there other stocks that provide better prospects with proven track records? Explore our free list of these great stocks here.
NB: Figures in this article are calculated using data from the trailing twelve months from 30 June 2017. This may not be consistent with full year annual report figures.
To help readers see pass the short term volatility of the financial market, we aim to bring you a long-term focused research analysis purely driven by fundamental data. Note that our analysis does not factor in the latest price sensitive company announcements.
The author is an independent contributor and at the time of publication had no position in the stocks mentioned.
