Is Ebix Inc’s (NASDAQ:EBIX) ROE Of 19.6% Sustainable?

The content of this article will benefit those of you who are starting to educate yourself about investing in the stock market and want to learn about Return on Equity using a real-life example.
With an ROE of 19.6%, Ebix Inc (NASDAQ:EBIX) outpaced its own industry which delivered a less exciting 12.5% over the past year. Superficially, this looks great since we know that EBIX has generated big profits with little equity capital; however, ROE doesn’t tell us how much EBIX has borrowed in debt. We’ll take a closer look today at factors like financial leverage to determine whether EBIX’s ROE is actually sustainable.
View our latest analysis for Ebix
What you must know about ROE
Return on Equity (ROE) is a measure of Ebix’s profit relative to its shareholders’ equity. For example, if the company invests $1 in the form of equity, it will generate $0.20 in earnings from this. While a higher ROE is preferred in most cases, there are several other factors we should consider before drawing any conclusions.
Return on Equity = Net Profit ÷ Shareholders Equity
ROE is measured against cost of equity in order to determine the efficiency of Ebix’s equity capital deployed. Its cost of equity is 11.6%. Given a positive discrepancy of 8.0% between return and cost, this indicates that Ebix pays less for its capital than what it generates in return, which is a sign of capital efficiency. ROE can be split up into three useful ratios: net profit margin, asset turnover, and financial leverage. This is called the Dupont Formula:
Dupont Formula
ROE = profit margin × asset turnover × financial leverage
ROE = (annual net profit ÷ sales) × (sales ÷ assets) × (assets ÷ shareholders’ equity)
ROE = annual net profit ÷ shareholders’ equity

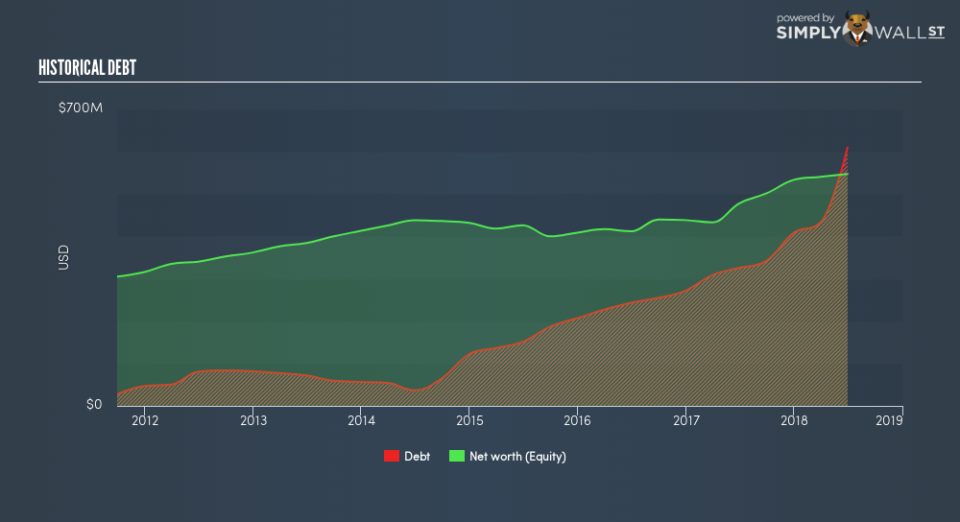
Essentially, profit margin shows how much money the company makes after paying for all its expenses. Asset turnover shows how much revenue Ebix can generate with its current asset base. Finally, financial leverage will be our main focus today. It shows how much of assets are funded by equity and can show how sustainable the company’s capital structure is. Since ROE can be inflated by excessive debt, we need to examine Ebix’s debt-to-equity level. At 111%, Ebix’s debt-to-equity ratio appears balanced and indicates the above-average ROE is generated from its capacity to increase profit without a large debt burden.
Next Steps:
While ROE is a relatively simple calculation, it can be broken down into different ratios, each telling a different story about the strengths and weaknesses of a company. Ebix’s ROE is impressive relative to the industry average and also covers its cost of equity. ROE is not likely to be inflated by excessive debt funding, giving shareholders more conviction in the sustainability of high returns. Although ROE can be a useful metric, it is only a small part of diligent research.
For Ebix, I’ve compiled three fundamental factors you should look at:
Financial Health: Does it have a healthy balance sheet? Take a look at our free balance sheet analysis with six simple checks on key factors like leverage and risk.
Valuation: What is Ebix worth today? Is the stock undervalued, even when its growth outlook is factored into its intrinsic value? The intrinsic value infographic in our free research report helps visualize whether Ebix is currently mispriced by the market.
Other High-Growth Alternatives : Are there other high-growth stocks you could be holding instead of Ebix? Explore our interactive list of stocks with large growth potential to get an idea of what else is out there you may be missing!
To help readers see past the short term volatility of the financial market, we aim to bring you a long-term focused research analysis purely driven by fundamental data. Note that our analysis does not factor in the latest price-sensitive company announcements.
The author is an independent contributor and at the time of publication had no position in the stocks mentioned. For errors that warrant correction please contact the editor at editorial-team@simplywallst.com.
