What Is eGain's (NASDAQ:EGAN) P/E Ratio After Its Share Price Rocketed?

eGain (NASDAQ:EGAN) shares have had a really impressive month, gaining 34%, after some slippage. But shareholders may not all be feeling jubilant, since the share price is still down 25% in the last year.
Assuming no other changes, a sharply higher share price makes a stock less attractive to potential buyers. While the market sentiment towards a stock is very changeable, in the long run, the share price will tend to move in the same direction as earnings per share. The implication here is that deep value investors might steer clear when expectations of a company are too high. Perhaps the simplest way to get a read on investors' expectations of a business is to look at its Price to Earnings Ratio (PE Ratio). Investors have optimistic expectations of companies with higher P/E ratios, compared to companies with lower P/E ratios.
View our latest analysis for eGain
Does eGain Have A Relatively High Or Low P/E For Its Industry?
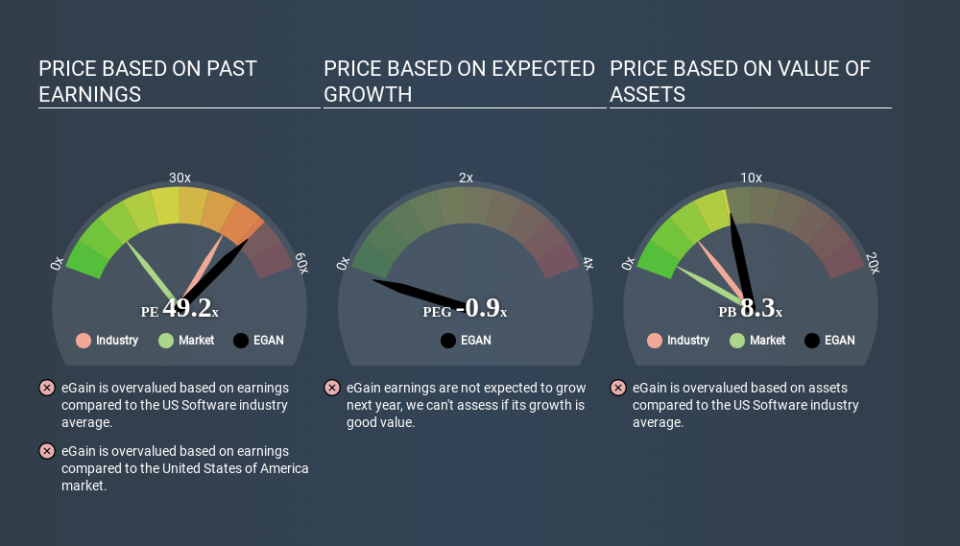
We can tell from its P/E ratio of 49.15 that there is some investor optimism about eGain. The image below shows that eGain has a higher P/E than the average (42.5) P/E for companies in the software industry.
Its relatively high P/E ratio indicates that eGain shareholders think it will perform better than other companies in its industry classification. Shareholders are clearly optimistic, but the future is always uncertain. So further research is always essential. I often monitor director buying and selling.
How Growth Rates Impact P/E Ratios
Generally speaking the rate of earnings growth has a profound impact on a company's P/E multiple. Earnings growth means that in the future the 'E' will be higher. That means unless the share price increases, the P/E will reduce in a few years. Then, a lower P/E should attract more buyers, pushing the share price up.
eGain's 123% EPS improvement over the last year was like bamboo growth after rain; rapid and impressive.
Don't Forget: The P/E Does Not Account For Debt or Bank Deposits
It's important to note that the P/E ratio considers the market capitalization, not the enterprise value. Thus, the metric does not reflect cash or debt held by the company. The exact same company would hypothetically deserve a higher P/E ratio if it had a strong balance sheet, than if it had a weak one with lots of debt, because a cashed up company can spend on growth.
Such expenditure might be good or bad, in the long term, but the point here is that the balance sheet is not reflected by this ratio.
eGain's Balance Sheet
With net cash of US$40m, eGain has a very strong balance sheet, which may be important for its business. Having said that, at 17% of its market capitalization the cash hoard would contribute towards a higher P/E ratio.
The Bottom Line On eGain's P/E Ratio
eGain has a P/E of 49.2. That's significantly higher than the average in its market, which is 14.0. Its net cash position is the cherry on top of its superb EPS growth. To us, this is the sort of company that we would expect to carry an above average price tag (relative to earnings). What we know for sure is that investors have become much more excited about eGain recently, since they have pushed its P/E ratio from 36.6 to 49.2 over the last month. For those who prefer to invest with the flow of momentum, that might mean it's time to put the stock on a watchlist, or research it. But the contrarian may see it as a missed opportunity.
Investors have an opportunity when market expectations about a stock are wrong. People often underestimate remarkable growth -- so investors can make money when fast growth is not fully appreciated. So this free report on the analyst consensus forecasts could help you make a master move on this stock.
Of course you might be able to find a better stock than eGain. So you may wish to see this free collection of other companies that have grown earnings strongly.
If you spot an error that warrants correction, please contact the editor at editorial-team@simplywallst.com. This article by Simply Wall St is general in nature. It does not constitute a recommendation to buy or sell any stock, and does not take account of your objectives, or your financial situation. Simply Wall St has no position in the stocks mentioned.
We aim to bring you long-term focused research analysis driven by fundamental data. Note that our analysis may not factor in the latest price-sensitive company announcements or qualitative material. Thank you for reading.
