Is Emera Incorporated's (TSE:EMA) Capital Allocation Ability Worth Your Time?

Today we are going to look at Emera Incorporated (TSE:EMA) to see whether it might be an attractive investment prospect. To be precise, we'll consider its Return On Capital Employed (ROCE), as that will inform our view of the quality of the business.
Firstly, we'll go over how we calculate ROCE. Second, we'll look at its ROCE compared to similar companies. Last but not least, we'll look at what impact its current liabilities have on its ROCE.
Return On Capital Employed (ROCE): What is it?
ROCE is a metric for evaluating how much pre-tax income (in percentage terms) a company earns on the capital invested in its business. Generally speaking a higher ROCE is better. In brief, it is a useful tool, but it is not without drawbacks. Renowned investment researcher Michael Mauboussin has suggested that a high ROCE can indicate that 'one dollar invested in the company generates value of more than one dollar'.
How Do You Calculate Return On Capital Employed?
The formula for calculating the return on capital employed is:
Return on Capital Employed = Earnings Before Interest and Tax (EBIT) ÷ (Total Assets - Current Liabilities)
Or for Emera:
0.053 = CA$1.4b ÷ (CA$32b - CA$4.7b) (Based on the trailing twelve months to March 2019.)
Therefore, Emera has an ROCE of 5.3%.
See our latest analysis for Emera
Is Emera's ROCE Good?
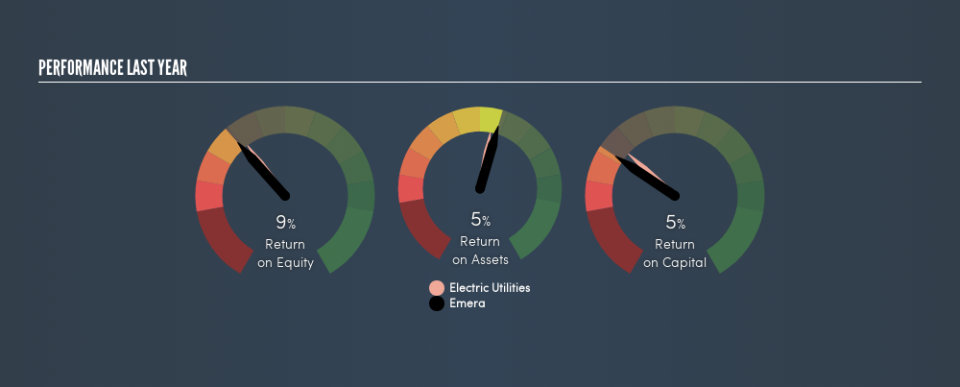
ROCE is commonly used for comparing the performance of similar businesses. It appears that Emera's ROCE is fairly close to the Electric Utilities industry average of 4.9%. Aside from the industry comparison, Emera's ROCE is mediocre in absolute terms, considering the risk of investing in stocks versus the safety of a bank account. It is possible that there are more rewarding investments out there.
You can see in the image below how Emera's ROCE compares to its industry. Click to see more on past growth.
Remember that this metric is backwards looking - it shows what has happened in the past, and does not accurately predict the future. Companies in cyclical industries can be difficult to understand using ROCE, as returns typically look high during boom times, and low during busts. This is because ROCE only looks at one year, instead of considering returns across a whole cycle. Since the future is so important for investors, you should check out our free report on analyst forecasts for Emera.
What Are Current Liabilities, And How Do They Affect Emera's ROCE?
Current liabilities include invoices, such as supplier payments, short-term debt, or a tax bill, that need to be paid within 12 months. Due to the way the ROCE equation works, having large bills due in the near term can make it look as though a company has less capital employed, and thus a higher ROCE than usual. To check the impact of this, we calculate if a company has high current liabilities relative to its total assets.
Emera has total assets of CA$32b and current liabilities of CA$4.7b. As a result, its current liabilities are equal to approximately 15% of its total assets. It is good to see a restrained amount of current liabilities, as this limits the effect on ROCE.
Our Take On Emera's ROCE
With that in mind, we're not overly impressed with Emera's ROCE, so it may not be the most appealing prospect. You might be able to find a better investment than Emera. If you want a selection of possible winners, check out this free list of interesting companies that trade on a P/E below 20 (but have proven they can grow earnings).
If you like to buy stocks alongside management, then you might just love this free list of companies. (Hint: insiders have been buying them).
We aim to bring you long-term focused research analysis driven by fundamental data. Note that our analysis may not factor in the latest price-sensitive company announcements or qualitative material.
If you spot an error that warrants correction, please contact the editor at editorial-team@simplywallst.com. This article by Simply Wall St is general in nature. It does not constitute a recommendation to buy or sell any stock, and does not take account of your objectives, or your financial situation. Simply Wall St has no position in the stocks mentioned. Thank you for reading.
