Is Emerson Electric Co (NYSE:EMR) A Financially Sound Company?

Investors pursuing a solid, dependable stock investment can often be led to Emerson Electric Co (NYSE:EMR), a large-cap worth US$44.13B. Big corporations are much sought after by risk-averse investors who find diversified revenue streams and strong capital returns attractive. But, the key to extending previous success is in the health of the company’s financials. Today we will look at Emerson Electric’s financial liquidity and debt levels, which are strong indicators for whether the company can weather economic downturns or fund strategic acquisitions for future growth. Note that this information is centred entirely on financial health and is a high-level overview, so I encourage you to look further into EMR here. Check out our latest analysis for Emerson Electric
How does EMR’s operating cash flow stack up against its debt?
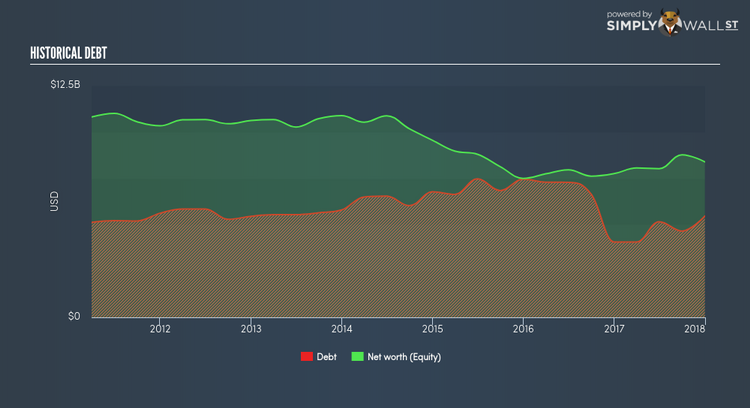
Over the past year, EMR has reduced its debt from US$6.64B to US$4.66B – this includes both the current and long-term debt. With this debt repayment, EMR’s cash and short-term investments stands at US$3.06B , ready to deploy into the business. On top of this, EMR has produced cash from operations of US$1.91B over the same time period, leading to an operating cash to total debt ratio of 41.07%, signalling that EMR’s operating cash is sufficient to cover its debt. This ratio can also be a sign of operational efficiency as an alternative to return on assets. In EMR’s case, it is able to generate 0.41x cash from its debt capital.
Can EMR meet its short-term obligations with the cash in hand?
At the current liabilities level of US$5.05B liabilities, the company has been able to meet these commitments with a current assets level of US$8.25B, leading to a 1.64x current account ratio. Usually, for Electrical companies, this is a suitable ratio as there’s enough of a cash buffer without holding too capital in low return investments.
Does EMR face the risk of succumbing to its debt-load?
With debt reaching 65.19% of equity, EMR may be thought of as relatively highly levered. This is not unusual for large-caps since debt tends to be less expensive than equity because interest payments are tax deductible. Accordingly, large companies often have an advantage over small-caps through lower cost of capital due to cheaper financing. No matter how high the company’s debt, if it can easily cover the interest payments, it’s considered to be efficient with its use of excess leverage. A company generating earnings before interest and tax (EBIT) at least three times its net interest payments is considered financially sound. For EMR, the ratio of 17.61x suggests that interest is comfortably covered. High interest coverage serves as an indication of the safety of a company, which highlights why many large organisations like EMR are considered a risk-averse investment.
Next Steps:
EMR’s high cash coverage means that, although its debt levels are high, the company is able to utilise its borrowings efficiently in order to generate cash flow. This may mean this is an optimal capital structure for the business, given that it is also meeting its short-term commitment. I admit this is a fairly basic analysis for EMR’s financial health. Other important fundamentals need to be considered alongside. I recommend you continue to research Emerson Electric to get a better picture of the large-cap by looking at:
Future Outlook: What are well-informed industry analysts predicting for EMR’s future growth? Take a look at our free research report of analyst consensus for EMR’s outlook.
Valuation: What is EMR worth today? Is the stock undervalued, even when its growth outlook is factored into its intrinsic value? The intrinsic value infographic in our free research report helps visualize whether EMR is currently mispriced by the market.
Other High-Performing Stocks: Are there other stocks that provide better prospects with proven track records? Explore our free list of these great stocks here.
To help readers see pass the short term volatility of the financial market, we aim to bring you a long-term focused research analysis purely driven by fundamental data. Note that our analysis does not factor in the latest price sensitive company announcements.
The author is an independent contributor and at the time of publication had no position in the stocks mentioned.
