Energy Annual Market Recap – 2017
A Glance at 2017
The EIA’s Forecast is Becoming More Bullish
Energy Markets – 2018 Forecast
WTI Crude oil price will continue to hover near current levels but could see further risk toward higher prices as demand remains solid, and supply divergences offset one another. U.S. production is likely to accelerate again in 2018 unless there are political missteps that derail this outcome. Venezuelan barrels could come off the market as the country falls further into geopolitical chaos. Gasoline demand could be mixed as driving mile declines will likely be offset by increasing exports. OPEC will likely play a large role in future production especially if prices reach historical averages.
A Glance at 2017
For most of 2017, traders heard that shale producers were sitting at $50 per barrel and ready to produce as much as they could at these levels. Despite the recent run-up in production to 9.78 million barrels per day, production dropped in the third quarter, in the wake of the three massive hurricanes that affected the United States. The most recent data released by the International Energy Agency and OPEC shows that U.S. shale would increase production by 870K barrels and 1-million barrels a day respectively.
These respective production levels would overwhelm demand, but growth could compensate for these increases. Economic growth in the United States is headed for a 3-plus-percent increasing in Q4, which would buoy consumption for petroleum products and liquids.
The EIA’s Forecast is Becoming More Bullish
Separately, the EIA believes there will be supply growth that will also overwhelm demand but at the same time describes the accelerating demand for products driven by gasoline. U.S. demand is at a record high, and refiners are trying to take advantage of this demand by running their refiners at elevated levels.

If refinery operations are high then it makes sense that demand for crude oil remains high, as refiners are running at record levels, to take advantage of high refining margins. With cracks at elevated levels, prompt crude oil is getting soaked up. The backwardation in the crude oil term structure shows that prices for February 2018 crude are more expensive than WTI crude oil delivered in December of 2018. Backwardation occurs when current demand is strong, generating an incentive to use crude oil now, and avoid storing it and selling it for a lower price in the future.
OPEC
OPEC has been very active, and the most recent extension of their current production quotas have kept the crude oil markets in balance. Production fell in November and put production compliance at a 115% rate, which shows determination from OPEC members. If OPEC can continue to remain vigilant, upward pressure on prices will help offset the weight of increasing shale production.
The question oil traders will contemplate is the ability of OPEC to employ consistent compliance throughout 2018. If inventories rebalance quickly there is the chance that cheating will begin. Russia has already stated that if inventories balance to average levels they would like to increase production.
Inventory Levels
OPEC’s production tactics will depend on what happens to global inventories. Total commercial stocks declined to put total global stocks at 2,940 million barrels down 40-million which was the lowest in 2-years. If compliance continues the current 100-million barrels surplus will evaporate putting global stocks back in balance. If prices drop, it will incent producers to cheat to recapture revenues.
Cheating in tandem with increasing shale production could make rebalancing elusive. The Energy Information Administration said in its recent Short-Term Energy Outlook that inventories will begin to rise in 2018 largely due to growth from U.S. shale. If the Agency is correct, prices will likely move lower.
Energy Markets – 2018 Forecast
Economic growth could be a catalyst that drives oil prices higher. WTI broke through resistance near 55 and has consolidated above that level. The 200-week moving average has been robust resistance as prices hover near that level at 57.76. Prices have not significantly closed above that 200-week moving average since October 2014. Prices could target the $75 level on a close above the 200-week moving average.
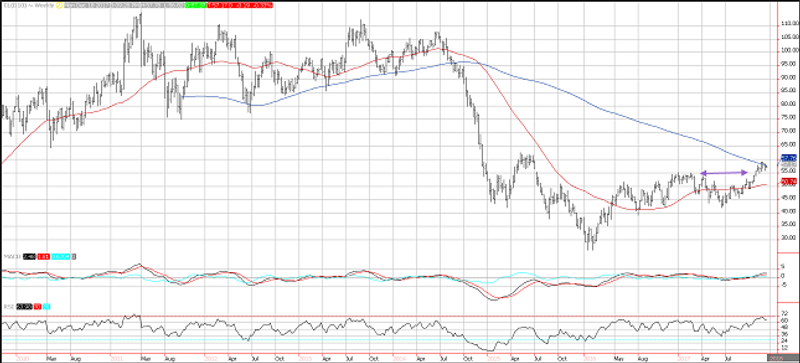
If you combine these technicals with rising sentiment that global economic growth will accelerate and OPEC production cuts outpace U.S. Shales production increases, at $75 target could be realistic.
This article was originally posted on FX Empire
More From FXEMPIRE:
US Dollar Index (DX) Futures Technical Analysis – Move Under 92.75 Could Trigger Steep Sell-off
Bitcoin Gold DASH and Monero forecast for the week of December 25, 2017, Technical Analysis
2017 Cryptos All-Stars, What Cryptocurrencies You Should invest in 2018?
Oil Price Fundamental Weekly Forecast – Forties Pipeline Shutdown Remains Supportive
Dow Jones 30 and NASDAQ 100 forecast for the week of December 25, 2017, Technical Analysis
