Eni (E) Beats Q2 Earnings Estimates, Hikes Share Buyback
Eni SpA E shares have risen 5.2% since the company reported strong results for the second quarter of 2022. The positive response could be attributed to the company’s hike in the share buyback program.
Eni reported second-quarter 2022 adjusted earnings from continuing operations of $2.28 per American Depository Receipt (“ADR”), beating the Zacks Consensus Estimate of $1.85. The bottom line significantly improved from the year-ago quarter’s 58 cents per ADR.
Total revenues in the quarter were $33,891 million, up from $19,631 million a year ago.
The strong quarterly results were driven by the higher realizations of average liquid and natural gas prices.
Eni SpA Price, Consensus and EPS Surprise
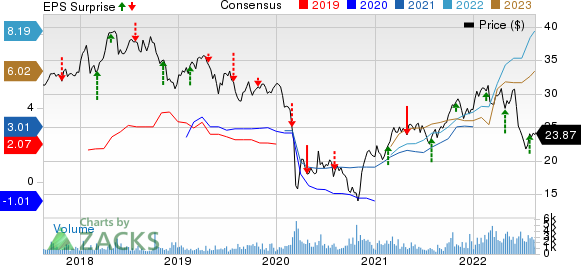
Eni SpA price-consensus-eps-surprise-chart | Eni SpA Quote
Share Buyback
Eni raised its share buyback after profits surged amid rising oil and natural gas prices. The company increased its share buyback program by €1.3 billion to an annual total of €2.4 billion.
Operational Performance
The company operates through four business segments — Exploration & Production, Global Gas & LNG Portfolio, Refining & Marketing and Chemicals and Plenitude & Power.
Exploration & Production
The total oil and gas production in the second quarter was 1,578 thousand barrels of oil equivalent per day, marginally down year over year.
Liquids production was 740 thousand barrels per day (MBbl/d), down 5% from the year-ago level of 814 MBbl/d. Yet, natural gas production increased 2% year over year to 4,447 million cubic feet per day.
The average realized price of liquids was $104.99 per barrel, up 65% from the $63.76 reported a year ago. The realized natural gas price was $9.13 per thousand cubic feet, up 84% from $4.95 a year ago.
The higher realizations of average liquid and natural gas prices aided the company’s Exploration & Production segment. The segment reported a profit of €4,867 million, which skyrocketed from the €1,841 million recorded in the June-end quarter of 2021.
Global Gas & LNG Portfolio
Eni’s worldwide sales of natural gas for the June-end quarter were recorded at 13.38 billion cubic meters (bcm), down 21% year over year.
The integrated energy major’s Global Gas & LNG Portfolio business segment reported an adjusted operating loss of €14 million, turning around from the year-ago profit of €24 million. Lower sales volumes hurt the segment.
Refining & Marketing and Chemicals
For the June-end quarter, total refinery throughputs were recorded at 7.41 million tons (mmtons), up 10% year over year. Petrochemical product sales declined 6% year over year to 1.07 mmtons for the second quarter of 2022.
For the quarter under review, the segment reported an adjusted operating profit of €1,104 million, significantly higher than €190 million in the year-ago quarter, primarily due to higher production in the Refining and Marketing segment.
Plenitude & Power
Retail gas sales managed by Plenitude declined 12% year over year to 0.95 bcm. Power sales in the open market declined 14% year over year.
Overall, from Plenitude & Power, the company reported a profit of €140 million, reflecting a 30% year-over-year increase.
Financials
As of Jun 30, Eni had long-term debt of €22,016 million, and cash and cash equivalents of €10,900 million. Its debt to capitalization was 34.8%.
For the reported quarter, net cash generated by operating activities amounted to €4,183 million. Capital expenditure totaled €1,829 million.
Outlook
For 2022, Eni expects a total hydrocarbon production of 1.67 million boe/d. The company expects to discover new exploration resources of around 700 million boe this year.
Eni projects its 2022 cash flow from operations, before changes in working capital at replacement cost, to grow to €20 billion, up from the previously stated €16 billion.
Moreover, the integrated energy major projects its organic capital expenditure for the year at €8.3 billion.
Zacks Rank & Other Stocks to Consider
The company currently carries a Zacks Rank #2 (Buy).
Investors interested in the energy sector might also look at the following stocks that reported solid second-quarter earnings and presently sport a Zacks Rank #1 (Strong Buy). You can see the complete list of today’s Zacks #1 Rank stocks here.
Petrobras PBR announced second-quarter earnings per American Depositary Share of $1.39, beating the Zacks Consensus Estimate of $1.14. The outperformance was driven by higher oil prices and strong downstream results.
Petrobrashas witnessed upward earnings estimate revisions for 2022 and 2023 in the past 30 days. The company currently has a Zacks Style Score of A for Value and Momentum, and B for Growth. PBR is expected to see earnings growth of 128.2% in 2022.
Cenovus Energy Inc. CVE reported second-quarter earnings per share of 93 cents, beating the Zacks Consensus Estimate of earnings of 89 cents. Strong quarterly earnings were driven by higher daily oil sand production.
Cenovus has witnessed upward earnings estimate revisions for 2022 and 2023 in the past 30 days. The company currently has a Zacks Style Score of A for Growth and B for Value. CVE is expected to see earnings growth of 321% for 2022.
TotalEnergies SE TTE reported second-quarter 2022 operating earnings of $3.75 per share, meeting the Zacks Consensus Estimate. The outperformance resulted from an increase in commodity prices.
TotalEnergies has witnessed upward earnings estimate revisions for 2022 and 2023 in the past 30 days. The company currently has a Zacks Style Score of A for Value and Growth. TTE is expected to see earnings growth of 107% in 2022.
Want the latest recommendations from Zacks Investment Research? Today, you can download 7 Best Stocks for the Next 30 Days. Click to get this free report
Petroleo Brasileiro S.A. Petrobras (PBR) : Free Stock Analysis Report
Eni SpA (E) : Free Stock Analysis Report
Cenovus Energy Inc (CVE) : Free Stock Analysis Report
TotalEnergies SE Sponsored ADR (TTE) : Free Stock Analysis Report
To read this article on Zacks.com click here.
Zacks Investment Research
