Are Eni S.p.A.’s (BIT:ENI) Returns On Investment Worth Your While?

Today we'll evaluate Eni S.p.A. (BIT:ENI) to determine whether it could have potential as an investment idea. In particular, we'll consider its Return On Capital Employed (ROCE), as that can give us insight into how profitably the company is able to employ capital in its business.
First, we'll go over how we calculate ROCE. Second, we'll look at its ROCE compared to similar companies. Then we'll determine how its current liabilities are affecting its ROCE.
What is Return On Capital Employed (ROCE)?
ROCE is a measure of a company's yearly pre-tax profit (its return), relative to the capital employed in the business. All else being equal, a better business will have a higher ROCE. In brief, it is a useful tool, but it is not without drawbacks. Renowned investment researcher Michael Mauboussin has suggested that a high ROCE can indicate that 'one dollar invested in the company generates value of more than one dollar'.
How Do You Calculate Return On Capital Employed?
The formula for calculating the return on capital employed is:
Return on Capital Employed = Earnings Before Interest and Tax (EBIT) ÷ (Total Assets - Current Liabilities)
Or for Eni:
0.083 = €7.9b ÷ (€122b - €27b) (Based on the trailing twelve months to September 2019.)
So, Eni has an ROCE of 8.3%.
View our latest analysis for Eni
Is Eni's ROCE Good?
ROCE is commonly used for comparing the performance of similar businesses. Using our data, Eni's ROCE appears to be around the 9.0% average of the Oil and Gas industry. Aside from the industry comparison, Eni's ROCE is mediocre in absolute terms, considering the risk of investing in stocks versus the safety of a bank account. Readers may find more attractive investment prospects elsewhere.
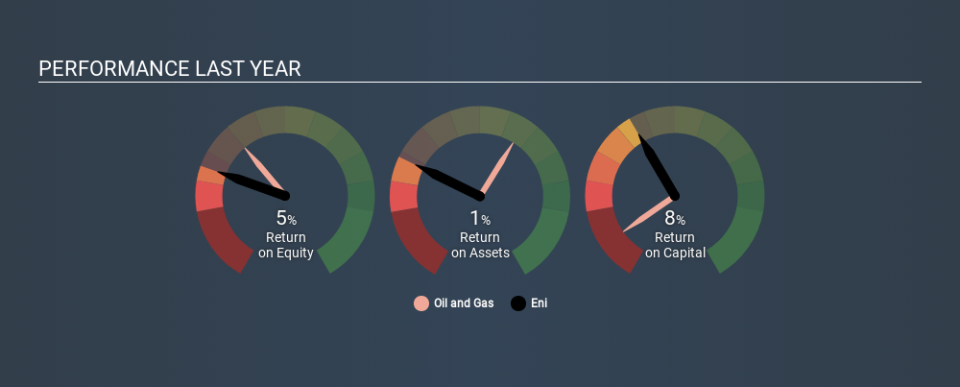
Eni reported an ROCE of 8.3% -- better than 3 years ago, when the company didn't make a profit. This makes us wonder if the company is improving. You can see in the image below how Eni's ROCE compares to its industry. Click to see more on past growth.
Remember that this metric is backwards looking - it shows what has happened in the past, and does not accurately predict the future. ROCE can be deceptive for cyclical businesses, as returns can look incredible in boom times, and terribly low in downturns. ROCE is only a point-in-time measure. Given the industry it operates in, Eni could be considered cyclical. Since the future is so important for investors, you should check out our free report on analyst forecasts for Eni.
Eni's Current Liabilities And Their Impact On Its ROCE
Current liabilities are short term bills and invoices that need to be paid in 12 months or less. Due to the way ROCE is calculated, a high level of current liabilities makes a company look as though it has less capital employed, and thus can (sometimes unfairly) boost the ROCE. To counter this, investors can check if a company has high current liabilities relative to total assets.
Eni has current liabilities of €27b and total assets of €122b. As a result, its current liabilities are equal to approximately 22% of its total assets. It is good to see a restrained amount of current liabilities, as this limits the effect on ROCE.
What We Can Learn From Eni's ROCE
That said, Eni's ROCE is mediocre, there may be more attractive investments around. You might be able to find a better investment than Eni. If you want a selection of possible winners, check out this free list of interesting companies that trade on a P/E below 20 (but have proven they can grow earnings).
If you like to buy stocks alongside management, then you might just love this free list of companies. (Hint: insiders have been buying them).
If you spot an error that warrants correction, please contact the editor at editorial-team@simplywallst.com. This article by Simply Wall St is general in nature. It does not constitute a recommendation to buy or sell any stock, and does not take account of your objectives, or your financial situation. Simply Wall St has no position in the stocks mentioned.
We aim to bring you long-term focused research analysis driven by fundamental data. Note that our analysis may not factor in the latest price-sensitive company announcements or qualitative material. Thank you for reading.
