How Epsilon Energy Ltd (TSE:EPS) Delivered A Better ROE Than Its Industry

The content of this article will benefit those of you who are starting to educate yourself about investing in the stock market and want to begin learning the link between company’s fundamentals and stock market performance.
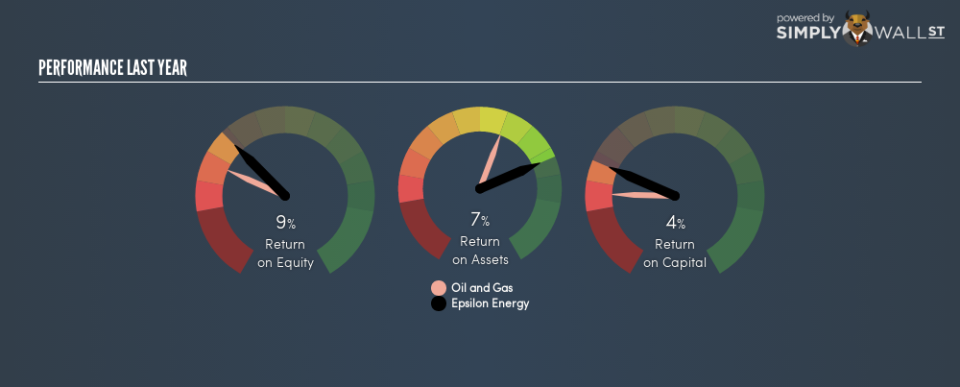
Epsilon Energy Ltd (TSE:EPS) outperformed the Oil and Gas Exploration and Production industry on the basis of its ROE – producing a higher 8.9% relative to the peer average of 5.4% over the past 12 months. Superficially, this looks great since we know that EPS has generated big profits with little equity capital; however, ROE doesn’t tell us how much EPS has borrowed in debt. Today, we’ll take a closer look at some factors like financial leverage to see how sustainable EPS’s ROE is.
View our latest analysis for Epsilon Energy
Peeling the layers of ROE – trisecting a company’s profitability
Return on Equity (ROE) weighs Epsilon Energy’s profit against the level of its shareholders’ equity. For example, if the company invests CA$1 in the form of equity, it will generate CA$0.089 in earnings from this. In most cases, a higher ROE is preferred; however, there are many other factors we must consider prior to making any investment decisions.
Return on Equity = Net Profit ÷ Shareholders Equity
ROE is measured against cost of equity in order to determine the efficiency of Epsilon Energy’s equity capital deployed. Its cost of equity is 11.1%. Given a discrepancy of -2.3% between return and cost, this indicated that Epsilon Energy may be paying more for its capital than what it’s generating in return. ROE can be split up into three useful ratios: net profit margin, asset turnover, and financial leverage. This is called the Dupont Formula:
Dupont Formula
ROE = profit margin × asset turnover × financial leverage
ROE = (annual net profit ÷ sales) × (sales ÷ assets) × (assets ÷ shareholders’ equity)
ROE = annual net profit ÷ shareholders’ equity
Basically, profit margin measures how much of revenue trickles down into earnings which illustrates how efficient the business is with its cost management. Asset turnover reveals how much revenue can be generated from Epsilon Energy’s asset base. The most interesting ratio, and reflective of sustainability of its ROE, is financial leverage. Since ROE can be inflated by excessive debt, we need to examine Epsilon Energy’s debt-to-equity level. At 1.0%, Epsilon Energy’s debt-to-equity ratio appears low and indicates the above-average ROE is generated from its capacity to increase profit without a large debt burden.

Next Steps:
ROE is one of many ratios which meaningfully dissects financial statements, which illustrates the quality of a company. Epsilon Energy exhibits a strong ROE against its peers, however it was not high enough to cover its own cost of equity this year. Its high ROE is not likely to be driven by high debt. Therefore, investors may have more confidence in the sustainability of this level of returns going forward. Although ROE can be a useful metric, it is only a small part of diligent research.
For Epsilon Energy, there are three key aspects you should look at:
Financial Health: Does it have a healthy balance sheet? Take a look at our free balance sheet analysis with six simple checks on key factors like leverage and risk.
Valuation: What is Epsilon Energy worth today? Is the stock undervalued, even when its growth outlook is factored into its intrinsic value? The intrinsic value infographic in our free research report helps visualize whether Epsilon Energy is currently mispriced by the market.
Other High-Growth Alternatives : Are there other high-growth stocks you could be holding instead of Epsilon Energy? Explore our interactive list of stocks with large growth potential to get an idea of what else is out there you may be missing!
To help readers see past the short term volatility of the financial market, we aim to bring you a long-term focused research analysis purely driven by fundamental data. Note that our analysis does not factor in the latest price-sensitive company announcements.
The author is an independent contributor and at the time of publication had no position in the stocks mentioned. For errors that warrant correction please contact the editor at editorial-team@simplywallst.com.
