Equinix (EQIX) Up 1.9% Since Earnings Report: Can It Continue?

A month has gone by since the last earnings report for Equinix, Inc. EQIX. Shares have added about 1.9% in that time frame.
Will the recent positive trend continue leading up to its next earnings release, or is EQIX due for a pullback? Before we dive into how investors and analysts have reacted as of late, let's take a quick look at its most recent earnings report in order to get a better handle on the important catalysts.
Equinix Tops Q4 AFFO & Revenue Estimates, Guides Well
Equinix posted better-than-expected fourth-quarter 2017 results, wherein the top and bottom lines surpassed the Zacks Consensus Estimate and increased from the year-ago quarter as well.
The company’s adjusted funds from operations (AFFO) advanced from $4.08 per share reported in the year-ago quarter to $4.82 per share. The Zacks Consensus Estimate was pegged at $4.80. The uptick primarily stemmed from robust top-line growth and strong operating performance, partially offset by elevated cost of revenues and share count.
AFFO is a non-GAAP financial measure generally used in the Real Estate Investment Trust (REIT) industry.
Quarter in Detail
Total revenues came in at $1.2 billion, up 27.3% from the year-ago quarter, beating the Zacks Consensus Estimate of $1.193 billion. This marked the 60th quarter of consecutive revenue growth. The year-over-year improvement was primarily driven by strong booking activity, global expansion, continued enterprise momentum and synergies from acquisition.
Equinix continues to witness solid demand for cloud services from corporations interested in enhancing the firms’ networks. The company observed revenue growth across all three geographic regions and verticals. Robust growth in the global Colocation and Interconnection platforms provided a boost to the top line.
Moreover, solid performance in MRR (monthly recurring revenues) per cabinet, MRR churn rate (2.2%) and cross connect additions drove the top line. Recurring revenues came in at $1.123 billion (94% of total revenues), up approximately 25.8% from the year-ago quarter. Non-recurring revenues climbed 54.6% to $77.6 million (6% of total revenues).
Revenues from the three geographic regions increased on a year-over-year basis as well. Revenues from the Americas, EMEA and Asia Pacific were up 38.9%, 22.4% and 9.8% to $606.2 million, $369.6 million, and $224.4 million, respectively.
Gross margin was 48.4%, down from 50.6% reported in the year-ago quarter, primarily due to elevated cost of revenues as a percentage of sales. Total operating expenses flared up 19.3% to $348.6 million. Further, operating expenses contracted 200 basis points (bps) as a percentage of revenues to 29%.
Adjusted earnings before interest, taxes, depreciation and amortization (EBITDA) came in at $564.8 million, up 29.4%. Adjusted EBITDA margins came in at 47.1% as compared with 46.3% reported in the year-ago quarter. AFFO increased 29.9% to $381.5 million during the reported quarter.
Balance Sheet & Cash Flow
Equinix exited the fourth quarter with cash, cash equivalents and short-term investments of $1.441 billion. The company’s total debt principal outstanding was $10.17 billion as on Dec 31, 2017. It generated cash of $1.439 billion from operating activities in 2017.
Guidance
Equinix provided outlook for the first quarter and full-year 2018. For 2018, the company anticipates revenues to come above $5.010 billion, reflecting an increase of 15% year over year. The company predicts adjusted EBITDA to exceed $2.385 billion.
The company anticipates full-year 2018 AFFO to be more than $1.635 billion, reflecting growth of 14% year over year.
The company expects cash gross margin for the full year to be approximately 67%. Cash selling, general and administrative (SG&A) expenses are projected in the range of 19-20% of revenues.
Coming to the first quarter, Equinix expects revenues in the range of $1.204-$1.212 billion (mid-point $1.208 billion). Adjusted EBITDA is likely to lie between $549 million and $557 million.
Cash gross margin for the first quarter is anticipated to be approximately 67%. Cash selling, general and administrative (SG&A) expenses are projected be approximately 21% of revenues.
How Have Estimates Been Moving Since Then?
It turns out, fresh estimates flatlined during the past month. There has been one revision higher for the current quarter compared to one lower.
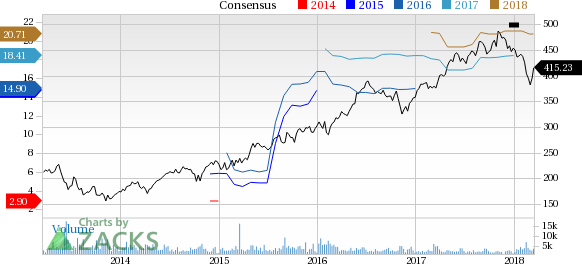
Equinix, Inc. Price and Consensus
Equinix, Inc. Price and Consensus | Equinix, Inc. Quote
VGM Scores
At this time, EQIX has a nice Growth Score of B, though it is lagging a bit on the momentum front with a C. The stock was allocated a grade of D on the value side, putting it in the bottom 40% for this investment strategy.
Overall, the stock has an aggregate VGM Score of C. If you aren't focused on one strategy, this score is the one you should be interested in.
Our style scores indicate that the stock is more suitable for growth investors than momentum investors.
Outlook
EQIX has a Zacks Rank #3 (Hold). We expect an in-line return from the stock in the next few months.
Want the latest recommendations from Zacks Investment Research? Today, you can download 7 Best Stocks for the Next 30 Days. Click to get this free report
Equinix, Inc. (EQIX) : Free Stock Analysis Report
To read this article on Zacks.com click here.
