How Do Estia Health Limited’s (ASX:EHE) Returns Compare To Its Industry?

Today we'll evaluate Estia Health Limited (ASX:EHE) to determine whether it could have potential as an investment idea. Specifically, we're going to calculate its Return On Capital Employed (ROCE), in the hopes of getting some insight into the business.
First up, we'll look at what ROCE is and how we calculate it. Then we'll compare its ROCE to similar companies. And finally, we'll look at how its current liabilities are impacting its ROCE.
Understanding Return On Capital Employed (ROCE)
ROCE is a measure of a company's yearly pre-tax profit (its return), relative to the capital employed in the business. All else being equal, a better business will have a higher ROCE. Overall, it is a valuable metric that has its flaws. Author Edwin Whiting says to be careful when comparing the ROCE of different businesses, since 'No two businesses are exactly alike.
How Do You Calculate Return On Capital Employed?
The formula for calculating the return on capital employed is:
Return on Capital Employed = Earnings Before Interest and Tax (EBIT) ÷ (Total Assets - Current Liabilities)
Or for Estia Health:
0.067 = AU$67m ÷ (AU$1.9b - AU$896m) (Based on the trailing twelve months to June 2019.)
So, Estia Health has an ROCE of 6.7%.
Check out our latest analysis for Estia Health
Is Estia Health's ROCE Good?
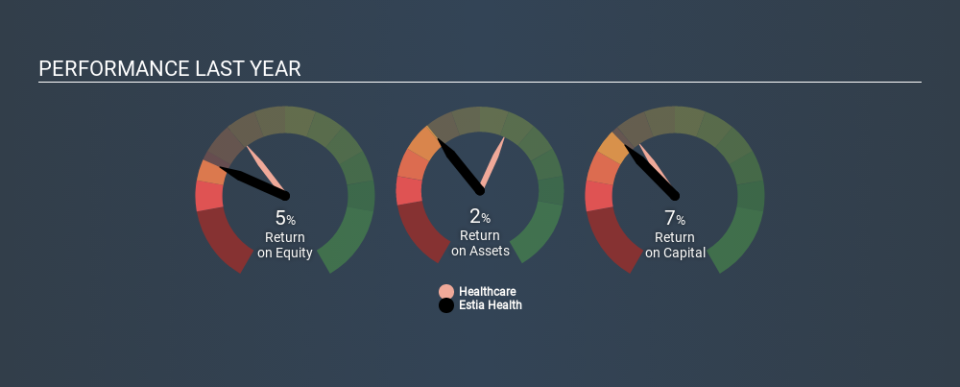
When making comparisons between similar businesses, investors may find ROCE useful. In this analysis, Estia Health's ROCE appears meaningfully below the 10.0% average reported by the Healthcare industry. This performance could be negative if sustained, as it suggests the business may underperform its industry. Aside from the industry comparison, Estia Health's ROCE is mediocre in absolute terms, considering the risk of investing in stocks versus the safety of a bank account. It is possible that there are more rewarding investments out there.
You can click on the image below to see (in greater detail) how Estia Health's past growth compares to other companies.
When considering this metric, keep in mind that it is backwards looking, and not necessarily predictive. ROCE can be misleading for companies in cyclical industries, with returns looking impressive during the boom times, but very weak during the busts. ROCE is, after all, simply a snap shot of a single year. Future performance is what matters, and you can see analyst predictions in our free report on analyst forecasts for the company.
Do Estia Health's Current Liabilities Skew Its ROCE?
Current liabilities are short term bills and invoices that need to be paid in 12 months or less. Due to the way ROCE is calculated, a high level of current liabilities makes a company look as though it has less capital employed, and thus can (sometimes unfairly) boost the ROCE. To check the impact of this, we calculate if a company has high current liabilities relative to its total assets.
Estia Health has total liabilities of AU$896m and total assets of AU$1.9b. Therefore its current liabilities are equivalent to approximately 47% of its total assets. Estia Health's ROCE is improved somewhat by its moderate amount of current liabilities.
The Bottom Line On Estia Health's ROCE
Despite this, its ROCE is still mediocre, and you may find more appealing investments elsewhere. Of course, you might find a fantastic investment by looking at a few good candidates. So take a peek at this free list of companies with modest (or no) debt, trading on a P/E below 20.
Estia Health is not the only stock that insiders are buying. For those who like to find winning investments this free list of growing companies with recent insider purchasing, could be just the ticket.
If you spot an error that warrants correction, please contact the editor at editorial-team@simplywallst.com. This article by Simply Wall St is general in nature. It does not constitute a recommendation to buy or sell any stock, and does not take account of your objectives, or your financial situation. Simply Wall St has no position in the stocks mentioned.
We aim to bring you long-term focused research analysis driven by fundamental data. Note that our analysis may not factor in the latest price-sensitive company announcements or qualitative material. Thank you for reading.
