Estimating The Fair Value Of Vector Group Ltd. (NYSE:VGR)
Key Insights
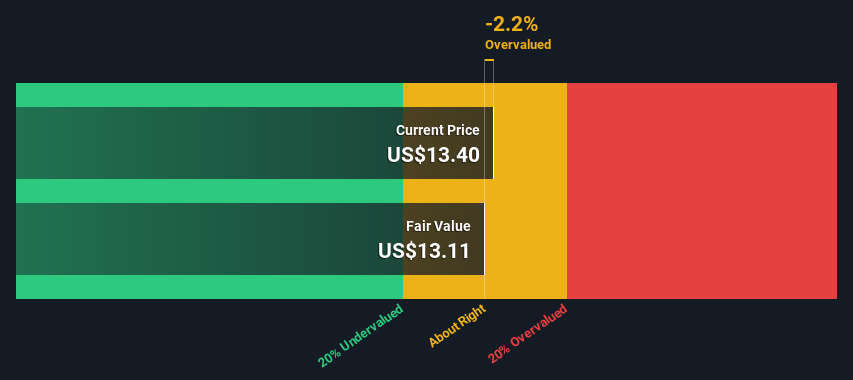
The projected fair value for Vector Group is US$13.11 based on 2 Stage Free Cash Flow to Equity
With US$13.40 share price, Vector Group appears to be trading close to its estimated fair value
When compared to theindustry average discount of -35%, Vector Group's competitors seem to be trading at a greater premium to fair value
Today we'll do a simple run through of a valuation method used to estimate the attractiveness of Vector Group Ltd. (NYSE:VGR) as an investment opportunity by taking the forecast future cash flows of the company and discounting them back to today's value. We will use the Discounted Cash Flow (DCF) model on this occasion. Believe it or not, it's not too difficult to follow, as you'll see from our example!
We generally believe that a company's value is the present value of all of the cash it will generate in the future. However, a DCF is just one valuation metric among many, and it is not without flaws. If you still have some burning questions about this type of valuation, take a look at the Simply Wall St analysis model.
Check out our latest analysis for Vector Group
Is Vector Group Fairly Valued?
We are going to use a two-stage DCF model, which, as the name states, takes into account two stages of growth. The first stage is generally a higher growth period which levels off heading towards the terminal value, captured in the second 'steady growth' period. To start off with, we need to estimate the next ten years of cash flows. Seeing as no analyst estimates of free cash flow are available to us, we have extrapolate the previous free cash flow (FCF) from the company's last reported value. We assume companies with shrinking free cash flow will slow their rate of shrinkage, and that companies with growing free cash flow will see their growth rate slow, over this period. We do this to reflect that growth tends to slow more in the early years than it does in later years.
Generally we assume that a dollar today is more valuable than a dollar in the future, so we discount the value of these future cash flows to their estimated value in today's dollars:
10-year free cash flow (FCF) estimate
2023 | 2024 | 2025 | 2026 | 2027 | 2028 | 2029 | 2030 | 2031 | 2032 | |
Levered FCF ($, Millions) | US$143.2m | US$130.5m | US$123.3m | US$119.3m | US$117.3m | US$116.6m | US$116.9m | US$117.8m | US$119.2m | US$120.9m |
Growth Rate Estimate Source | Est @ -13.49% | Est @ -8.82% | Est @ -5.56% | Est @ -3.27% | Est @ -1.67% | Est @ -0.55% | Est @ 0.24% | Est @ 0.79% | Est @ 1.17% | Est @ 1.44% |
Present Value ($, Millions) Discounted @ 7.2% | US$134 | US$114 | US$100.0 | US$90.2 | US$82.7 | US$76.7 | US$71.7 | US$67.4 | US$63.6 | US$60.1 |
("Est" = FCF growth rate estimated by Simply Wall St)
Present Value of 10-year Cash Flow (PVCF) = US$859m
After calculating the present value of future cash flows in the initial 10-year period, we need to calculate the Terminal Value, which accounts for all future cash flows beyond the first stage. For a number of reasons a very conservative growth rate is used that cannot exceed that of a country's GDP growth. In this case we have used the 5-year average of the 10-year government bond yield (2.1%) to estimate future growth. In the same way as with the 10-year 'growth' period, we discount future cash flows to today's value, using a cost of equity of 7.2%.
Terminal Value (TV)= FCF2032 × (1 + g) ÷ (r – g) = US$121m× (1 + 2.1%) ÷ (7.2%– 2.1%) = US$2.4b
Present Value of Terminal Value (PVTV)= TV / (1 + r)10= US$2.4b÷ ( 1 + 7.2%)10= US$1.2b
The total value, or equity value, is then the sum of the present value of the future cash flows, which in this case is US$2.0b. To get the intrinsic value per share, we divide this by the total number of shares outstanding. Compared to the current share price of US$13.4, the company appears around fair value at the time of writing. The assumptions in any calculation have a big impact on the valuation, so it is better to view this as a rough estimate, not precise down to the last cent.
Important Assumptions
Now the most important inputs to a discounted cash flow are the discount rate, and of course, the actual cash flows. If you don't agree with these result, have a go at the calculation yourself and play with the assumptions. The DCF also does not consider the possible cyclicality of an industry, or a company's future capital requirements, so it does not give a full picture of a company's potential performance. Given that we are looking at Vector Group as potential shareholders, the cost of equity is used as the discount rate, rather than the cost of capital (or weighted average cost of capital, WACC) which accounts for debt. In this calculation we've used 7.2%, which is based on a levered beta of 0.869. Beta is a measure of a stock's volatility, compared to the market as a whole. We get our beta from the industry average beta of globally comparable companies, with an imposed limit between 0.8 and 2.0, which is a reasonable range for a stable business.
SWOT Analysis for Vector Group
Strength
Debt is well covered by earnings.
Dividends are covered by earnings and cash flows.
Dividend is in the top 25% of dividend payers in the market.
Weakness
Earnings growth over the past year underperformed the Tobacco industry.
Current share price is above our estimate of fair value.
Opportunity
Annual revenue is forecast to grow faster than the American market.
Threat
Debt is not well covered by operating cash flow.
Total liabilities exceed total assets, which raises the risk of financial distress.
Looking Ahead:
Although the valuation of a company is important, it shouldn't be the only metric you look at when researching a company. It's not possible to obtain a foolproof valuation with a DCF model. Preferably you'd apply different cases and assumptions and see how they would impact the company's valuation. For instance, if the terminal value growth rate is adjusted slightly, it can dramatically alter the overall result. For Vector Group, we've compiled three important factors you should further examine:
Risks: For example, we've discovered 4 warning signs for Vector Group (2 shouldn't be ignored!) that you should be aware of before investing here.
Future Earnings: How does VGR's growth rate compare to its peers and the wider market? Dig deeper into the analyst consensus number for the upcoming years by interacting with our free analyst growth expectation chart.
Other High Quality Alternatives: Do you like a good all-rounder? Explore our interactive list of high quality stocks to get an idea of what else is out there you may be missing!
PS. The Simply Wall St app conducts a discounted cash flow valuation for every stock on the NYSE every day. If you want to find the calculation for other stocks just search here.
Have feedback on this article? Concerned about the content? Get in touch with us directly. Alternatively, email editorial-team (at) simplywallst.com.
This article by Simply Wall St is general in nature. We provide commentary based on historical data and analyst forecasts only using an unbiased methodology and our articles are not intended to be financial advice. It does not constitute a recommendation to buy or sell any stock, and does not take account of your objectives, or your financial situation. We aim to bring you long-term focused analysis driven by fundamental data. Note that our analysis may not factor in the latest price-sensitive company announcements or qualitative material. Simply Wall St has no position in any stocks mentioned.
Join A Paid User Research Session
You’ll receive a US$30 Amazon Gift card for 1 hour of your time while helping us build better investing tools for the individual investors like yourself. Sign up here
