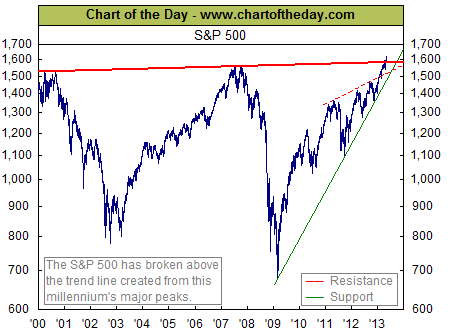
ETF Chart of the Day: S&P 500
The S&P 500 has broken above the 1,600 mark to a fresh all-time high. ETFs pegged to the index such as SPDR S&P 500 (SPY) , Vanguard S&P 500 ETF (VOO) and iShares S&P 500 Index (IVV) have posted total return of about 15% so far this year but investors are worried about a potential summer correction after the strong rally.
A look at some S&P 500 charts could provide some perspective.
“There are obviously no overhead levels to work with and that makes targets somewhat speculative. Nonetheless, we can pencil in levels, which when tested, would call for deeper investigation. If these levels coincide with over stretched indicators as well as a sentiment extreme, then the odds of a reversal would be high,” said Investors Intelligence technical analyst Tarquin Coe in a newsletter this week.
“The first level to watch is the 1678 region. This target was simply deduced by adding the point break of the 2002 low in 2009, to the 2007 high, approximately 101.84. This would form a mirror image of the sharp 2009 bear-trap bottom, essentially a bull-trap. The move would be just as painful, financially and psychological, for those buying at the highs as it was for those who sold at the lows in 2009,” he wrote.
“The second level is 1790.68, a Fibonacci 1.236 extension of the 2009 low to the 2007 peak. Beyond that, the third level to circle, a 1.38 Fibonacci extension at 1923.44,” Coe added.
Meanwhile, chartoftheday.com points out that the latest leg of the post-financial crisis rally has the S&P 500 breaking above resistance created by the last two all-time record highs.
Full disclosure: Tom Lydon’s clients own SPY.


