An ETF That Reduces Volatility and Tops the Broader Market
Still just a sliver of the overall exchange traded funds market, actively managed ETFs have about $21 billion in combined assets under management. With more of these funds popping, the chances increase that investors can find some hidden gems in the actively managed ETF space.
That is arguable the category in which the WBI SMID Tactical Value Fund (WBIB) resides. As of the end of the second quarter, WBIB “produced a year-to-date total net return of 1.94%, outpacing the U.S. equity market return of 1.21%, based on the total return of the S&P 500 Index. With total assets under management of $103 million and strong liquidity deriving from an average of 262 thousand shares daily, the Fund seeks long-term capital appreciation and the potential for current income, while also seeking to protect principal during unfavorable market conditions,” according to New Jersey-based WBI, the ETF’s issuer.
As is the case with other WBI ETFs, including growing products such as the WBI Tactical Income Shares (WBII) and the WBI Large Cap Tactical Growth Shares (WBIE) , WBIB looks to optimize returns during bull markets while providing capital preservation in the event of bear markets. WBIB’s stock selection process is quantitatively driven, which helps remove emotion from the process while employing dynamic trailing stops to protect profits and guard against swift market reversals. [A Nifty Active ETF]
WBIB currently has about 30 equity positions with weights ranging from 0.77% to nearly 4.8%. Familiar names in the ETF’s lineup include Henry Schein (HSIC), Cracker Barrel (CBRL), Equifax (EFX), Costco (COST) and Dow component Johnson & Johnson (JNJ).
WBI Investments introduced its lineup of 10 active ETFs just 11 months ago, immediately racing to the $1 billion in assets under management mark. The company ended May with $1.5 billion in combined active ETF assets with all 10 of its funds residing north of the $100 million in AUM level. [Another Good Year for new ETFs]
For the month ended June 30, WBIB “also provided solid diversification benefits, with a Beta of only 0.82, a correlation of 0.82 and a coefficient of determination of just 0.67 to the S&P 500 Index. During the first half of 2015, the Fund has a Win: Loss ratio of 1.3 to 1, with 73 positive days versus only 56 negative days. The Fund’s active strategy aims to capture up-market performance and avoiding down-market performance,” according to WBI.
WBIB charges 1% per year.
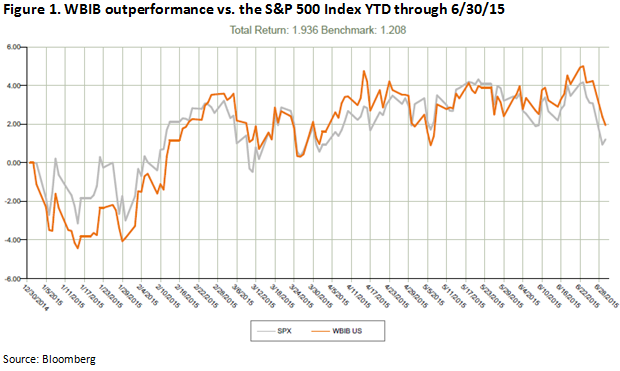
Chart Courtesy: WBI
