Ethereum on the Ropes with a New 2022 Low and sub-$1,700 in Play
Key Insights:
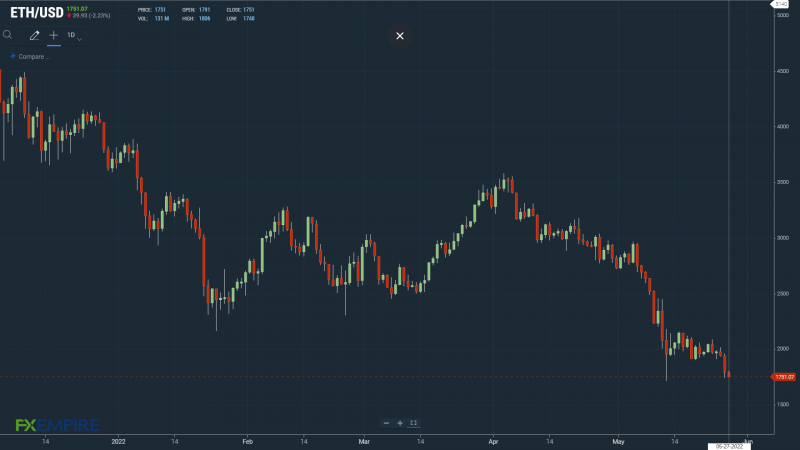
It was a bearish Thursday, with Ethereum (ETH) sliding by 7.73% to end the day at $1,791.
A broad-based crypto sell-off saw ETH slide through Major Support Levels to test support at $1,750.
Technical indicators are bearish, with ETH sitting well below the 50-day.
On Thursday, Ethereum (ETH) tumbled by 7.73%, weighed by the broader crypto market. Following a 1.87% loss from Wednesday, ETH ended the day at $1,791.
ETH tracked the broader market through the day, sliding to an early afternoon low of $1,741 before finding support.
The extended sell-off saw ETH fall through the day’s Major Support Levels. Late in the day, the Third Major Support Level at $1,791 pegged ETH back from a return to $1,800 levels.
Total Liquidations Surge to Leave ETH in the Deep Red
On Thursday, there were no major news events to send Ethereum to sub-$1,800 levels. The bearish sentiment from across the broader market did the damage.
Economic uncertainty stemming from inflation and Fed monetary policy continued to pressure the majors.
Liquidations from across the crypto market reflected investor angst.
According to Coinglass, total crypto liquidations stood at $497.05 million, with 130,355 traders liquidated.
For Ethereum, total liquidations over the last 24-hours stood at $221.73 million.

Ethereum (ETH) Price Action
At the time of writing, ETH was down 2.23% to $1,751. A mixed start to the day saw ETH rise to an early morning high of $1,806 before sliding to a low of $1,748.
Technical Indicators
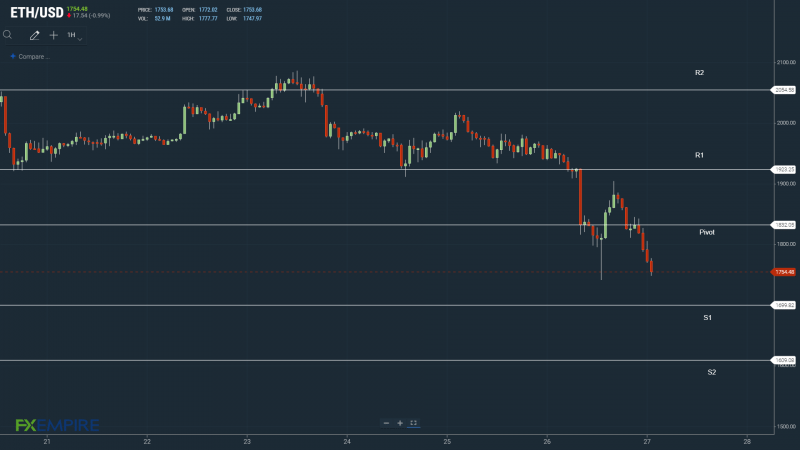
ETH will need to move through the $1,832 pivot to target the First Major Resistance Level at $1,923.
ETH would need broader crypto market support to return to $1,850 levels.
An extended rebound would test the Second Major Resistance Level at $2,055. The Third Major Resistance Level sits at $2,278.
Failure to move through the pivot would bring the First Major Support Level at $1,700 into play. Barring another extended sell-off, ETH should avoid sub-$1,600. The Second Major Support Level at $1,609 should limit the downside.
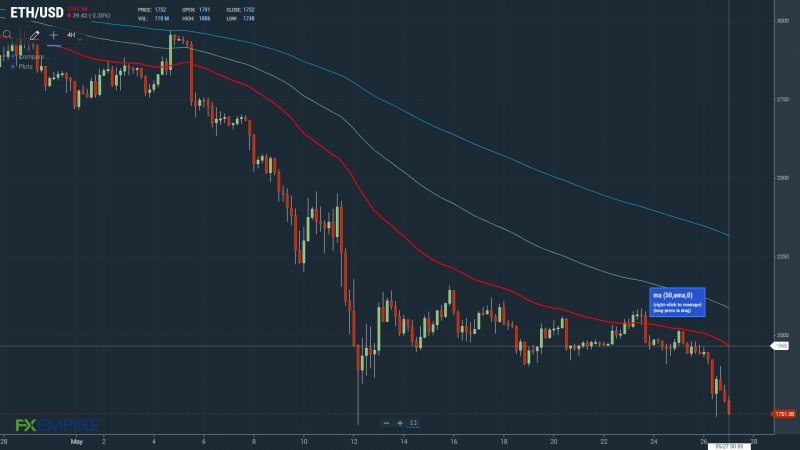
Looking at the EMAs and the 4-hourly candlestick chart (above), it is a bearish signal. ETH sits below the 50-day EMA, currently at $1,968. This morning, the 50-day EMA pulled back from the 100-day EMA. The 100-day EMA fell back from the 200-day EMA; ETH price negative.
Failure to move through the 50-day EMA would bring sub-$1,700 support levels into play.
This article was originally posted on FX Empire
