EUR/AUD Long with 3 Degrees of Confirmation
Talking Points:
Weekly Uptrend & Diamond Consolidation Pattern
Parallel Channel Formation on EUR/AUD Daily Chart
The Ideal Time Frame for Buying EUR/AUD
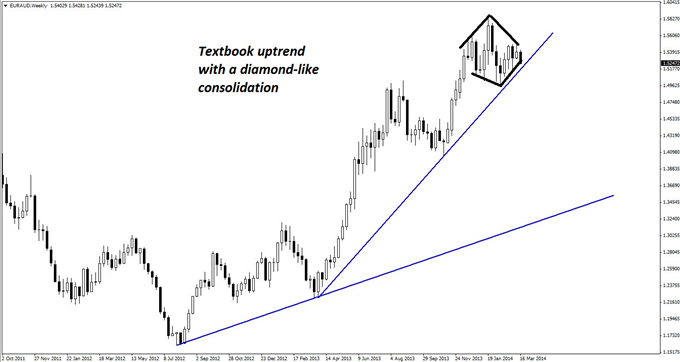
Continuing a theme we saw a lot of last week, EURAUD is showing a classic uptrend on the weekly chart, and is also sporting a somewhat small diamond formation, as shown below.
Guest Commentary: Weekly Uptrend & Diamond Consolidation in EUR/AUD
While diamond patterns are interesting studies, this one does not provide much in the way of tradable information. Thus, in order to discern a more manageable pattern, the daily chart below must be examined.
As shown, there is a convenient parallel rising channel clearly visible on this time frame. With price moving swiftly down to test the bottom of the channel, some breakout traders will no doubt be considering short positions, especially since some pattern traders could be eyeing a rough-looking head-and-shoulders pattern as well.
Guest Commentary: Daily Channel Formation in EUR/AUD
It is usually unwise to go against the prevailing trend, however, and as a result, it is more preferable to treat this as a pullback within the overall uptrend and look for long opportunities instead.
Indeed, there are several indications on the four-hour chart below that this recent downward movement may be coming to at least a temporary halt, the most convincing of which is the downward wedge formation. Elliott wave theory provides good reason to be suspicious of this downward move because wave four actually overlaps wave one.
While the bottom of the wedge has been exceeded, this is actually fairly common, as price may potentially be making a final swipe to the down side with momentum. To account for the momentum, support has been estimated a little beyond the projected line on the chart, which leaves the key zone as 1.5124-1.5226.
Guest Commentary: Downward Wedge Pattern in EUR/AUD
At 102 pips, the risk zone for this trade is somewhat larger than usual for EURAUD. In order to reduce risk, however, long positions can instead be initiated on the hourly chart (not shown), where reasonable entries should produce stops in the 30- to 60-pip region.
Entries can be taken on bullish reversal divergence, bullish engulfing patterns, and/or pin bars on the hourly chart. The usual advice, which includes being prepared to make two or three attempts at the entry, applies even more in this case, as the zone of support is on the large side. Nonetheless, it is well within acceptable risk parameters when considering there is approximately 300 pips to reach the recent high, not to mention 600 pips to the highest high.
It may take a little while for this set-up to mature, or it may occur in the next few hours. Regardless, this is a set-up that is well worth considering due to the multiple pattern confirmation.
By Kaye Lee, private fund trader and head trader consultant, StraightTalkTrading.com
DailyFX provides forex news and technical analysis on the trends that influence the global currency markets.
Learn forex trading with a free practice account and trading charts from FXCM.


