EUR/USD Mid-Session Technical Analysis for May 24, 2019
The Euro is trading slightly higher shortly before the release of the U.S. Durable Goods data at 12:30 GMT. Given yesterday’s sharp rally in response to the weaker than expected manufacturing and services PMI data, today’s durable goods report takes on greater importance.
Yesterday’s news increased the chances of a Fed rate cut later in the year, driving U.S. Treasury yields sharply lower while making the U.S. Dollar a less-attractive asset.
Core Durable Goods Orders are expected to come in at 0.1% and Durable Goods Orders are expected to come in at 2.0%. Weaker-than-expected numbers could trigger another spike to the upside.
At 12:20 GMT, the EUR/USD is trading at 1.1190, up 0.0008 or +0.07%.
Daily Technical Analysis
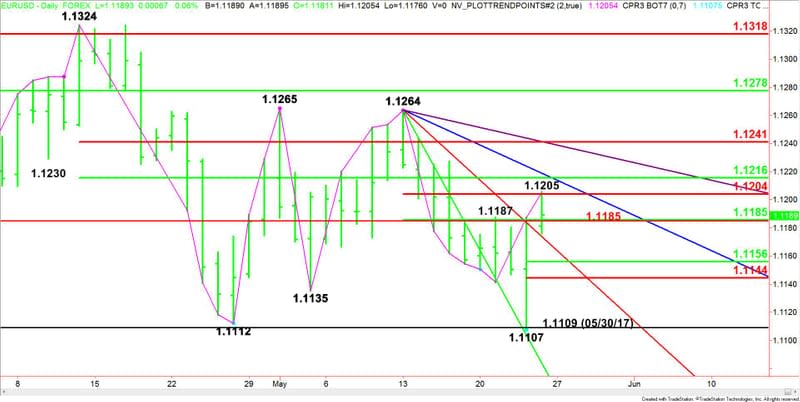
The main trend is down according to the daily swing chart, however, momentum shifted to the upside with the formation of a closing price reversal bottom and today’s subsequent confirmation.
The main trend will change to up on a trade through 1.1264. A move through 1.1107 will negate the closing price reversal bottom and signal a resumption of the downtrend.
The main range is 1.1324 to 1.1107. Its retracement zone at 1.1216 to 1.1241 is the next upside target.
The short-term range is 1.1264 to 1.1107. Its retracement zone at 1.1185 to 1.1204 is currently being tested. Earlier in the session, the upper or Fibonacci level at 1.1204 stopped the rally at 1.1205.
On the downside, support is a price cluster at 1.1185.
The one-day range is 1.1107 to 1.1205. If 1.1185 fails as support then look for a potential break into its retracement zone at 1.1156 to 1.1144. If the EUR/USD is going to move higher then buyers should come in on a test of this zone.
Daily Technical Forecast
Based on the early price action, the direction of the EUR/USD on Friday is likely to be determined by trader reaction to the price cluster at 1.1185.
Bullish Scenario
A sustained move over 1.1185 will indicate the presence of buyers. If this creates enough upside momentum then look for the rally to extend into the 1.1204 to 1.1205, followed by the main 50% level at 1.1216, followed by a downtrending Gann angle at 1.1219. This is a potential trigger point for an acceleration into a resistance cluster at 1.1241 to 1.1242.
Bearish Scenario
A sustained move under 1.1185 will signal the presence of sellers. Crossing to the weak side of the downtrending Gann angle at 1.1174 will indicate the selling is getting stronger. This could lead to a further break into 1.1156 to 1.1144.
This article was originally posted on FX Empire
More From FXEMPIRE:
S&P 500 Weekly Price Forecast – Stock markets get hammered for the week
Gold Weekly Price Forecast – Gold markets bounce during the week
Natural Gas Price Forecast – Natural gas markets find buyers on Friday
Gold Price Forecast – Gold markets stabilize going into the weekend
S&P 500 Price Forecast – Stock market tries to rally but fails
