EUR/USD Mid-Session Technical Analysis for October 6, 2021
The Euro is down against the U.S. Dollar on Wednesday amid jitters that surging energy prices could spur inflation and interest rate hikes, and as traders awaited U.S. jobs data for clues on the timing of Federal Reserve policy tightening.
The greenback is moving higher as investors increased bets on the Fed to begin tapering asset purchases this year and lay the ground for an exit from pandemic-era interest rate settings well before the European Central Bank.
At 17:47 GMT, the EUR/USD is trading 1.1552, down 0.0046 or -0.39%.
In U.S. economic news, private payrolls increased more than expected in September as COVID-19 infections started subsiding, boosting hiring at restaurants and other high-contact businesses.
The ADP National Employment Report released on Wednesday supported expectations that job growth picked up last month, though it has a poor record predicting the private payrolls count in the Labor Department’s more comprehensive and closely watched employment report.
Daily Swing Chart Technical Analysis
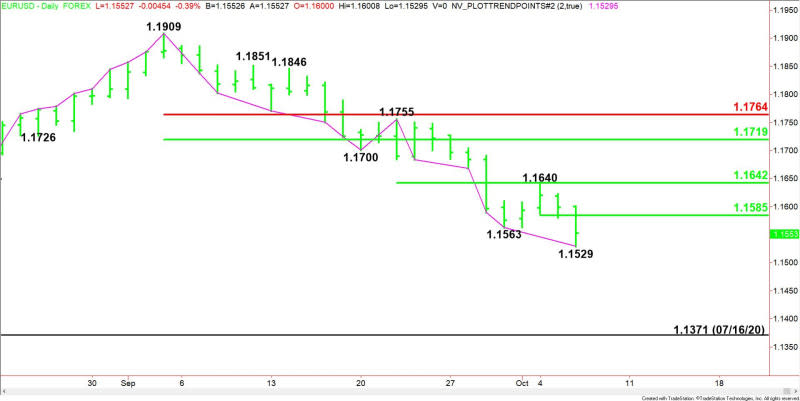
The main trend is down according to the daily swing chart. The down trend was reaffirmed earlier in the session when sellers took out the previous low at 1.1563. Taking out the intraday low at 1.1529 will reaffirm the downtrend. The main trend will change to up on a trade through 1.1755.
The minor trend is also down. A trade through 1.1640 will change the minor trend to up. This will shift momentum to the upside.
The first minor range is 1.1640 to 1.1529. Its 50% level at 1.1585 is the nearest resistance.
The second minor range is 1.1755 to 1.1529. Its 50% level at 1.1642 is the next resistance level.
Daily Swing Chart Technical Forecast
The direction of the EUR/USD into the close on Wednesday is likely to be determined by trader reaction to 1.1565.
Bullish Scenario
A sustained move over 1.1565 will indicate the presence of buyers. If this move creates enough upside momentum then look for the move to possibly extend into 1.1585, followed by 1.1598.
Bearish Scenario
A sustained move under 1.1565 will signal the presence of sellers. If this move generates enough downside momentum then look for the selling to possibly extend into 1.1529.
For a look at all of today’s economic events, check out our economic calendar.
This article was originally posted on FX Empire
