Do You Like Eversource Energy (NYSE:ES) At This P/E Ratio?

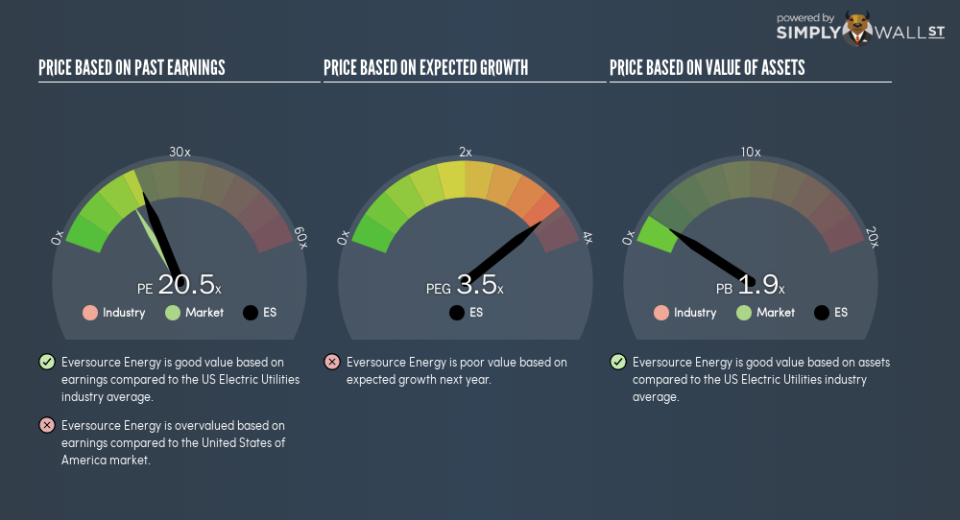
This article is written for those who want to get better at using price to earnings ratios (P/E ratios). We’ll show how you can use Eversource Energy’s (NYSE:ES) P/E ratio to inform your assessment of the investment opportunity. Based on the last twelve months, Eversource Energy’s P/E ratio is 20.54. That means that at current prices, buyers pay $20.54 for every $1 in trailing yearly profits.
Check out our latest analysis for Eversource Energy
How Do I Calculate Eversource Energy’s Price To Earnings Ratio?
The formula for P/E is:
Price to Earnings Ratio = Share Price ÷ Earnings per Share (EPS)
Or for Eversource Energy:
P/E of 20.54 = $67.25 ÷ $3.27 (Based on the year to September 2018.)
Is A High Price-to-Earnings Ratio Good?
A higher P/E ratio means that investors are paying a higher price for each $1 of company earnings. That isn’t necessarily good or bad, but a high P/E implies relatively high expectations of what a company can achieve in the future.
How Growth Rates Impact P/E Ratios
P/E ratios primarily reflect market expectations around earnings growth rates. That’s because companies that grow earnings per share quickly will rapidly increase the ‘E’ in the equation. That means even if the current P/E is high, it will reduce over time if the share price stays flat. A lower P/E should indicate the stock is cheap relative to others — and that may attract buyers.
Eversource Energy’s earnings per share grew by -6.1% in the last twelve months. And it has bolstered its earnings per share by 5.9% per year over the last five years.
How Does Eversource Energy’s P/E Ratio Compare To Its Peers?
The P/E ratio indicates whether the market has higher or lower expectations of a company. As you can see below Eversource Energy has a P/E ratio that is fairly close for the average for the electric utilities industry, which is 20.6.
Eversource Energy’s P/E tells us that market participants think its prospects are roughly in line with its industry. So if Eversource Energy actually outperforms its peers going forward, that should be a positive for the share price. I inform my view byby checking management tenure and remuneration, among other things.
A Limitation: P/E Ratios Ignore Debt and Cash In The Bank
Don’t forget that the P/E ratio considers market capitalization. Thus, the metric does not reflect cash or debt held by the company. Theoretically, a business can improve its earnings (and produce a lower P/E in the future), by taking on debt (or spending its remaining cash).
Spending on growth might be good or bad a few years later, but the point is that the P/E ratio does not account for the option (or lack thereof).
How Does Eversource Energy’s Debt Impact Its P/E Ratio?
Net debt totals 64% of Eversource Energy’s market cap. This is a reasonably significant level of debt — all else being equal you’d expect a much lower P/E than if it had net cash.
The Verdict On Eversource Energy’s P/E Ratio
Eversource Energy’s P/E is 20.5 which is above average (16.5) in the US market. With significant debt and fairly modest EPS growth last year, shareholders are betting on sustained improvement.
Investors should be looking to buy stocks that the market is wrong about. People often underestimate remarkable growth — so investors can make money when fast growth is not fully appreciated. So this free visual report on analyst forecasts could hold they key to an excellent investment decision.
Of course you might be able to find a better stock than Eversource Energy. So you may wish to see this free collection of other companies that have grown earnings strongly.
To help readers see past the short term volatility of the financial market, we aim to bring you a long-term focused research analysis purely driven by fundamental data. Note that our analysis does not factor in the latest price-sensitive company announcements.
The author is an independent contributor and at the time of publication had no position in the stocks mentioned. For errors that warrant correction please contact the editor at editorial-team@simplywallst.com.
