Examining Niu Technologies’s (NASDAQ:NIU) Weak Return On Capital Employed

Today we'll evaluate Niu Technologies (NASDAQ:NIU) to determine whether it could have potential as an investment idea. In particular, we'll consider its Return On Capital Employed (ROCE), as that can give us insight into how profitably the company is able to employ capital in its business.
First of all, we'll work out how to calculate ROCE. Second, we'll look at its ROCE compared to similar companies. And finally, we'll look at how its current liabilities are impacting its ROCE.
Return On Capital Employed (ROCE): What is it?
ROCE is a measure of a company's yearly pre-tax profit (its return), relative to the capital employed in the business. All else being equal, a better business will have a higher ROCE. Overall, it is a valuable metric that has its flaws. Author Edwin Whiting says to be careful when comparing the ROCE of different businesses, since 'No two businesses are exactly alike.'
How Do You Calculate Return On Capital Employed?
Analysts use this formula to calculate return on capital employed:
Return on Capital Employed = Earnings Before Interest and Tax (EBIT) ÷ (Total Assets - Current Liabilities)
Or for Niu Technologies:
0.024 = CN¥16m ÷ (CN¥1.4b - CN¥780m) (Based on the trailing twelve months to June 2019.)
So, Niu Technologies has an ROCE of 2.4%.
Check out our latest analysis for Niu Technologies
Is Niu Technologies's ROCE Good?
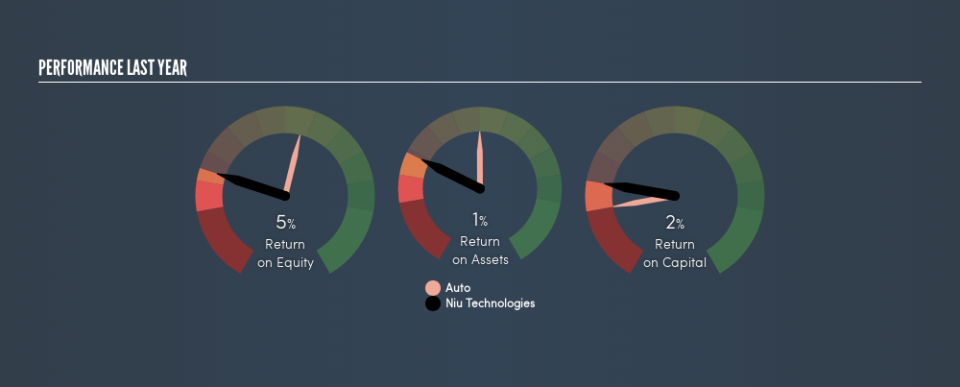
One way to assess ROCE is to compare similar companies. Using our data, Niu Technologies's ROCE appears to be significantly below the 9.2% average in the Auto industry. This performance is not ideal, as it suggests the company may not be deploying its capital as effectively as some competitors. Regardless of how Niu Technologies stacks up against its industry, its ROCE in absolute terms is quite low (especially compared to a bank account). There are potentially more appealing investments elsewhere.
The image below shows how Niu Technologies's ROCE compares to its industry, and you can click it to see more detail on its past growth.
When considering this metric, keep in mind that it is backwards looking, and not necessarily predictive. Companies in cyclical industries can be difficult to understand using ROCE, as returns typically look high during boom times, and low during busts. This is because ROCE only looks at one year, instead of considering returns across a whole cycle. Since the future is so important for investors, you should check out our free report on analyst forecasts for Niu Technologies.
How Niu Technologies's Current Liabilities Impact Its ROCE
Current liabilities include invoices, such as supplier payments, short-term debt, or a tax bill, that need to be paid within 12 months. The ROCE equation subtracts current liabilities from capital employed, so a company with a lot of current liabilities appears to have less capital employed, and a higher ROCE than otherwise. To check the impact of this, we calculate if a company has high current liabilities relative to its total assets.
Niu Technologies has total liabilities of CN¥780m and total assets of CN¥1.4b. As a result, its current liabilities are equal to approximately 54% of its total assets. Current liabilities of this level result in a meaningful boost to Niu Technologies's ROCE.
Our Take On Niu Technologies's ROCE
Niu Technologies's ROCE is also pretty low (in absolute terms), making the stock look unattractive on this analysis. Of course, you might find a fantastic investment by looking at a few good candidates. So take a peek at this free list of companies with modest (or no) debt, trading on a P/E below 20.
I will like Niu Technologies better if I see some big insider buys. While we wait, check out this free list of growing companies with considerable, recent, insider buying.
We aim to bring you long-term focused research analysis driven by fundamental data. Note that our analysis may not factor in the latest price-sensitive company announcements or qualitative material.
If you spot an error that warrants correction, please contact the editor at editorial-team@simplywallst.com. This article by Simply Wall St is general in nature. It does not constitute a recommendation to buy or sell any stock, and does not take account of your objectives, or your financial situation. Simply Wall St has no position in the stocks mentioned. Thank you for reading.
