Examining Peab AB (publ)’s (STO:PEAB B) Weak Return On Capital Employed

Want to participate in a short research study? Help shape the future of investing tools and you could win a $250 gift card!
Today we are going to look at Peab AB (publ) (STO:PEAB B) to see whether it might be an attractive investment prospect. In particular, we'll consider its Return On Capital Employed (ROCE), as that can give us insight into how profitably the company is able to employ capital in its business.
First of all, we'll work out how to calculate ROCE. Next, we'll compare it to others in its industry. And finally, we'll look at how its current liabilities are impacting its ROCE.
What is Return On Capital Employed (ROCE)?
ROCE measures the 'return' (pre-tax profit) a company generates from capital employed in its business. All else being equal, a better business will have a higher ROCE. Overall, it is a valuable metric that has its flaws. Renowned investment researcher Michael Mauboussin has suggested that a high ROCE can indicate that 'one dollar invested in the company generates value of more than one dollar'.
How Do You Calculate Return On Capital Employed?
The formula for calculating the return on capital employed is:
Return on Capital Employed = Earnings Before Interest and Tax (EBIT) ÷ (Total Assets - Current Liabilities)
Or for Peab:
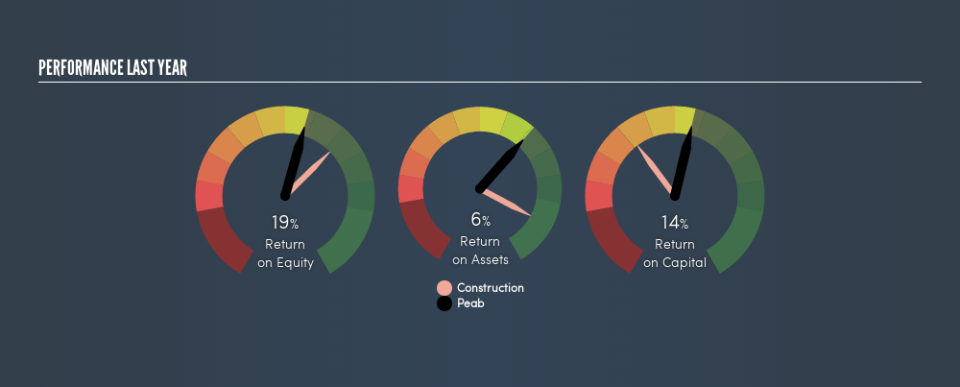
0.14 = kr2.4b ÷ (kr37b - kr20b) (Based on the trailing twelve months to December 2018.)
So, Peab has an ROCE of 14%.
View our latest analysis for Peab
Is Peab's ROCE Good?
One way to assess ROCE is to compare similar companies. We can see Peab's ROCE is meaningfully below the Construction industry average of 17%. This performance could be negative if sustained, as it suggests the business may underperform its industry. Independently of how Peab compares to its industry, its ROCE in absolute terms appears decent, and the company may be worthy of closer investigation.
As we can see, Peab currently has an ROCE of 14% compared to its ROCE 3 years ago, which was 7.6%. This makes us think about whether the company has been reinvesting shrewdly.
It is important to remember that ROCE shows past performance, and is not necessarily predictive. ROCE can be misleading for companies in cyclical industries, with returns looking impressive during the boom times, but very weak during the busts. ROCE is only a point-in-time measure. Since the future is so important for investors, you should check out our free report on analyst forecasts for Peab.
What Are Current Liabilities, And How Do They Affect Peab's ROCE?
Current liabilities are short term bills and invoices that need to be paid in 12 months or less. Due to the way the ROCE equation works, having large bills due in the near term can make it look as though a company has less capital employed, and thus a higher ROCE than usual. To counter this, investors can check if a company has high current liabilities relative to total assets.
Peab has total assets of kr37b and current liabilities of kr20b. Therefore its current liabilities are equivalent to approximately 53% of its total assets. This is admittedly a high level of current liabilities, improving ROCE substantially.
Our Take On Peab's ROCE
This ROCE is pretty good, but remember that it would look less impressive with fewer current liabilities. Peab shapes up well under this analysis, but it is far from the only business delivering excellent numbers . You might also want to check this free collection of companies delivering excellent earnings growth.
For those who like to find winning investments this free list of growing companies with recent insider purchasing, could be just the ticket.
We aim to bring you long-term focused research analysis driven by fundamental data. Note that our analysis may not factor in the latest price-sensitive company announcements or qualitative material.
If you spot an error that warrants correction, please contact the editor at editorial-team@simplywallst.com. This article by Simply Wall St is general in nature. It does not constitute a recommendation to buy or sell any stock, and does not take account of your objectives, or your financial situation. Simply Wall St has no position in the stocks mentioned. Thank you for reading.
