How Exela Technologies Inc (NASDAQ:XELA) Delivered A Better ROE Than Its Industry

Exela Technologies Inc (NASDAQ:XELA) delivered an ROE of 15.24% over the past 12 months, which is an impressive feat relative to its industry average of 13.86% during the same period. While the impressive ratio tells us that XELA has made significant profits from little equity capital, ROE doesn’t tell us if XELA has borrowed debt to make this happen. In this article, we’ll closely examine some factors like financial leverage to evaluate the sustainability of XELA’s ROE. Check out our latest analysis for Exela Technologies
Peeling the layers of ROE – trisecting a company’s profitability
Return on Equity (ROE) weighs Exela Technologies’s profit against the level of its shareholders’ equity. For example, if the company invests $1 in the form of equity, it will generate $0.15 in earnings from this. In most cases, a higher ROE is preferred; however, there are many other factors we must consider prior to making any investment decisions.
Return on Equity = Net Profit ÷ Shareholders Equity
Returns are usually compared to costs to measure the efficiency of capital. Exela Technologies’s cost of equity is 16.31%. This means Exela Technologies’s returns actually do not cover its own cost of equity, with a discrepancy of -1.07%. This isn’t sustainable as it implies, very simply, that the company pays more for its capital than what it generates in return. ROE can be broken down into three different ratios: net profit margin, asset turnover, and financial leverage. This is called the Dupont Formula:
Dupont Formula
ROE = profit margin × asset turnover × financial leverage
ROE = (annual net profit ÷ sales) × (sales ÷ assets) × (assets ÷ shareholders’ equity)
ROE = annual net profit ÷ shareholders’ equity
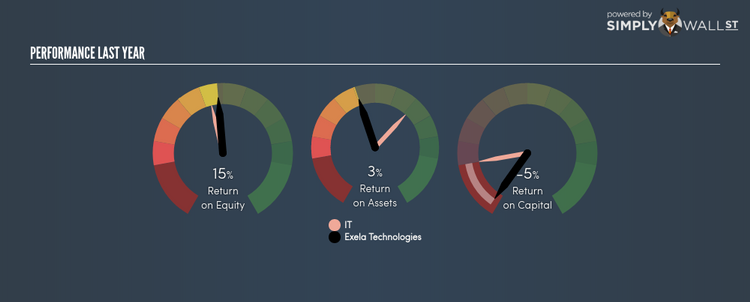
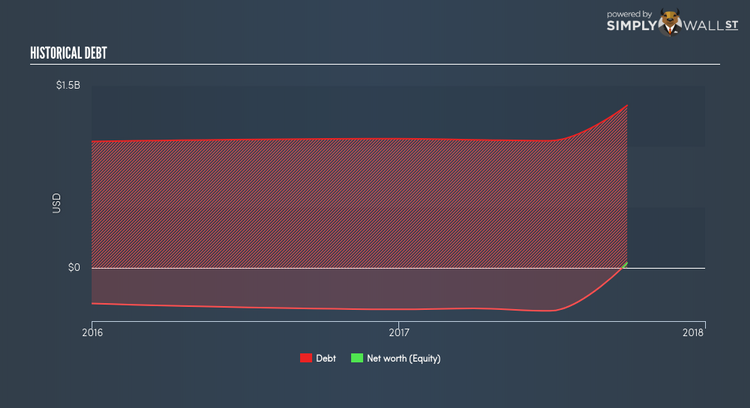
Basically, profit margin measures how much of revenue trickles down into earnings which illustrates how efficient the business is with its cost management. The other component, asset turnover, illustrates how much revenue Exela Technologies can make from its asset base. The most interesting ratio, and reflective of sustainability of its ROE, is financial leverage. Since ROE can be inflated by excessive debt, we need to examine Exela Technologies’s debt-to-equity level. The debt-to-equity ratio currently stands at over 2.5 times, meaning the above-average ratio is a result of a large amount of debt.
What this means for you:
Are you a shareholder? XELA’s ROE is impressive relative to the industry average, though its returns were not strong enough to cover its own cost of equity. Additionally, its high debt level appears to be the driver of a strong ROE and is something you should be mindful of before adding more of XELA to your portfolio. If you’re looking for new ideas for high-returning stocks, you should take a look at our free platform to see the list of stocks with Return on Equity over 20%.
Are you a potential investor? If XELA has been on your watch list for a while, making an investment decision based on ROE alone is unwise. I recommend you do additional fundamental analysis by looking through our most recent infographic report on Exela Technologies to help you make a more informed investment decision.
To help readers see pass the short term volatility of the financial market, we aim to bring you a long-term focused research analysis purely driven by fundamental data. Note that our analysis does not factor in the latest price sensitive company announcements.
The author is an independent contributor and at the time of publication had no position in the stocks mentioned.
