eXp World Holdings (EXPI) Just Overtook the 200-Day Moving Average
eXp World Holdings (EXPI) is looking like an interesting pick from a technical perspective, as the company reached a key level of support. Recently, EXPI crossed above the 200-day moving average, suggesting a long-term bullish trend.
The 200-day simple moving average is widely-used by traders and analysts, and helps establish market trends for stocks, commodities, indexes, and other financial instruments over the long term. The indicator moves higher or lower together with longer-term price moves, serving as a support or resistance level.
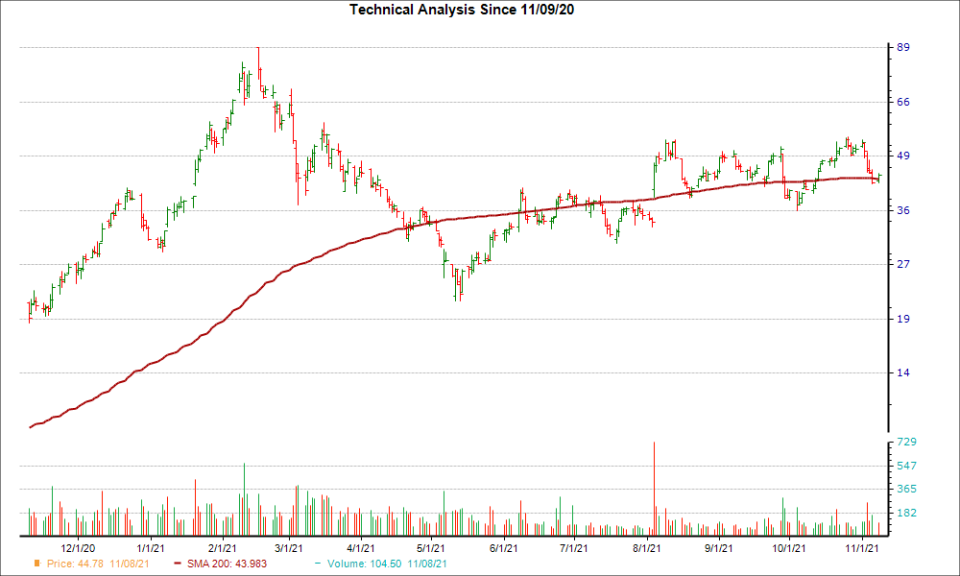
Over the past four weeks, EXPI has gained 7.5%. The company is currently ranked a Zacks Rank #3 (Hold), another strong indication the stock could move even higher.
Looking at EXPI's earnings estimate revisions, investors will be even more convinced of the bullish uptrend. There have been 1 higher compared to none lower for the current fiscal year, and the consensus estimate has moved up as well.
With a winning combination of earnings estimate revisions and hitting a key technical level, investors should keep their eye on EXPI for more gains in the near future.
Want the latest recommendations from Zacks Investment Research? Today, you can download 7 Best Stocks for the Next 30 Days. Click to get this free report
Exp World Holdings, Inc. (EXPI) : Free Stock Analysis Report
To read this article on Zacks.com click here.
