Should You Expect Aroundtown SA. (FRA:AT1) To Continue Delivering An ROE Of 19.58%?

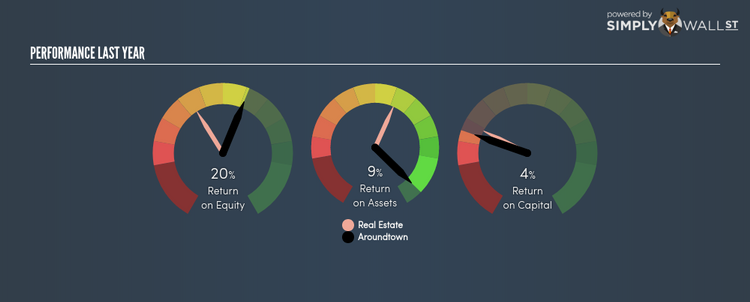
Aroundtown SA. (DB:AT1) delivered an ROE of 19.58% over the past 12 months, which is an impressive feat relative to its industry average of 10.89% during the same period. Superficially, this looks great since we know that AT1 has generated big profits with little equity capital; however, ROE doesn’t tell us how much AT1 has borrowed in debt. Today, we’ll take a closer look at some factors like financial leverage to see how sustainable AT1’s ROE is. Check out our latest analysis for Aroundtown
What you must know about ROE
Return on Equity (ROE) is a measure of Aroundtown’s profit relative to its shareholders’ equity. An ROE of 19.58% implies €0.2 returned on every €1 invested. While a higher ROE is preferred in most cases, there are several other factors we should consider before drawing any conclusions.
Return on Equity = Net Profit ÷ Shareholders Equity
Returns are usually compared to costs to measure the efficiency of capital. Aroundtown’s cost of equity is 10.46%. This means Aroundtown returns enough to cover its own cost of equity, with a buffer of 9.12%. This sustainable practice implies that the company pays less for its capital than what it generates in return. ROE can be dissected into three distinct ratios: net profit margin, asset turnover, and financial leverage. This is called the Dupont Formula:
Dupont Formula
ROE = profit margin × asset turnover × financial leverage
ROE = (annual net profit ÷ sales) × (sales ÷ assets) × (assets ÷ shareholders’ equity)
ROE = annual net profit ÷ shareholders’ equity
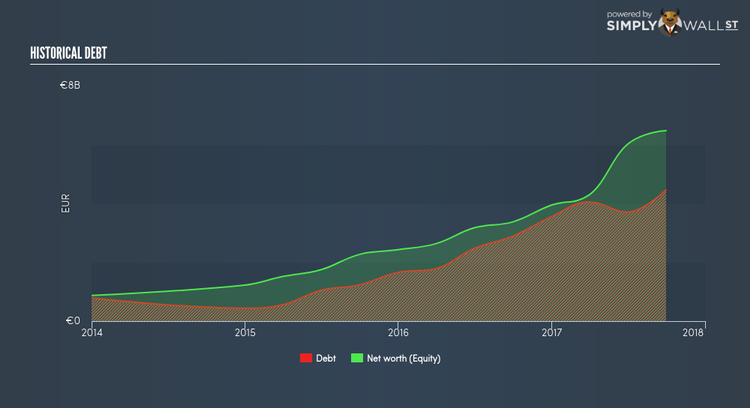
Basically, profit margin measures how much of revenue trickles down into earnings which illustrates how efficient the business is with its cost management. Asset turnover reveals how much revenue can be generated from Aroundtown’s asset base. Finally, financial leverage will be our main focus today. It shows how much of assets are funded by equity and can show how sustainable the company’s capital structure is. Since ROE can be artificially increased through excessive borrowing, we should check Aroundtown’s historic debt-to-equity ratio. Currently the debt-to-equity ratio stands at a reasonable 68.90%, which means its above-average ROE is driven by its ability to grow its profit without a significant debt burden.
Next Steps:
ROE is a simple yet informative ratio, illustrating the various components that each measure the quality of the overall stock. Aroundtown exhibits a strong ROE against its peers, as well as sufficient returns to cover its cost of equity. ROE is not likely to be inflated by excessive debt funding, giving shareholders more conviction in the sustainability of high returns. ROE is a helpful signal, but it is definitely not sufficient on its own to make an investment decision.
For Aroundtown, I’ve compiled three key factors you should look at:
Financial Health: Does it have a healthy balance sheet? Take a look at our free balance sheet analysis with six simple checks on key factors like leverage and risk.
Future Earnings: How does Aroundtown’s growth rate compare to its peers and the wider market? Dig deeper into the analyst consensus number for the upcoming years by interacting with our free analyst growth expectation chart.
Other High-Growth Alternatives : Are there other high-growth stocks you could be holding instead of Aroundtown? Explore our interactive list of stocks with large growth potential to get an idea of what else is out there you may be missing!
To help readers see pass the short term volatility of the financial market, we aim to bring you a long-term focused research analysis purely driven by fundamental data. Note that our analysis does not factor in the latest price sensitive company announcements.
The author is an independent contributor and at the time of publication had no position in the stocks mentioned.
