Should You Expect Ivanhoe Mines Ltd (TSE:IVN) To Continue Delivering An ROE Of 19.49%?

I am writing today to help inform people who are new to the stock market and want to begin learning the link between company’s fundamentals and stock market performance.
Ivanhoe Mines Ltd (TSE:IVN) delivered an ROE of 19.49% over the past 12 months, which is an impressive feat relative to its industry average of 10.73% during the same period. On the surface, this looks fantastic since we know that IVN has made large profits from little equity capital; however, ROE doesn’t tell us if management have borrowed heavily to make this happen. Today, we’ll take a closer look at some factors like financial leverage to see how sustainable IVN’s ROE is.
Check out our latest analysis for Ivanhoe Mines
Breaking down Return on Equity
Return on Equity (ROE) weighs Ivanhoe Mines’s profit against the level of its shareholders’ equity. It essentially shows how much the company can generate in earnings given the amount of equity it has raised. Generally speaking, a higher ROE is preferred; however, there are other factors we must also consider before making any conclusions.
Return on Equity = Net Profit ÷ Shareholders Equity
Returns are usually compared to costs to measure the efficiency of capital. Ivanhoe Mines’s cost of equity is 16.43%. Given a positive discrepancy of 3.05% between return and cost, this indicates that Ivanhoe Mines pays less for its capital than what it generates in return, which is a sign of capital efficiency. ROE can be dissected into three distinct ratios: net profit margin, asset turnover, and financial leverage. This is called the Dupont Formula:
Dupont Formula
ROE = profit margin × asset turnover × financial leverage
ROE = (annual net profit ÷ sales) × (sales ÷ assets) × (assets ÷ shareholders’ equity)
ROE = annual net profit ÷ shareholders’ equity

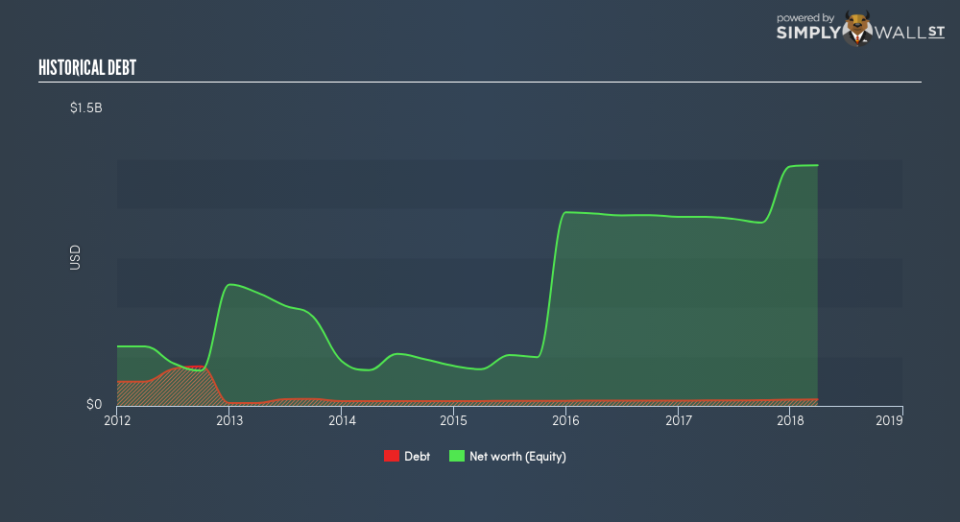
The first component is profit margin, which measures how much of sales is retained after the company pays for all its expenses. Asset turnover reveals how much revenue can be generated from Ivanhoe Mines’s asset base. And finally, financial leverage is simply how much of assets are funded by equity, which exhibits how sustainable the company’s capital structure is. Since financial leverage can artificially inflate ROE, we need to look at how much debt Ivanhoe Mines currently has. Currently the debt-to-equity ratio stands at a low 2.65%, which means its above-average ROE is driven by its ability to grow its profit without a significant debt burden.
Next Steps:
While ROE is a relatively simple calculation, it can be broken down into different ratios, each telling a different story about the strengths and weaknesses of a company. Ivanhoe Mines’s ROE is impressive relative to the industry average and also covers its cost of equity. Its high ROE is not likely to be driven by high debt. Therefore, investors may have more confidence in the sustainability of this level of returns going forward. ROE is a helpful signal, but it is definitely not sufficient on its own to make an investment decision.
For Ivanhoe Mines, there are three key factors you should look at:
Financial Health: Does it have a healthy balance sheet? Take a look at our free balance sheet analysis with six simple checks on key factors like leverage and risk.
Management:Have insiders been ramping up their shares to take advantage of the market’s sentiment for Ivanhoe Mines’s future outlook? Check out our management and board analysis with insights on CEO compensation and governance factors.
Other High-Growth Alternatives : Are there other high-growth stocks you could be holding instead of Ivanhoe Mines? Explore our interactive list of stocks with large growth potential to get an idea of what else is out there you may be missing!
To help readers see past the short term volatility of the financial market, we aim to bring you a long-term focused research analysis purely driven by fundamental data. Note that our analysis does not factor in the latest price-sensitive company announcements.
The author is an independent contributor and at the time of publication had no position in the stocks mentioned. For errors that warrant correction please contact the editor at editorial-team@simplywallst.com.
