A Fascinating GBP/CAD Short Unfolding Now
Talking Points:
Double Trend Line Break in GBP/CAD
Key Zone for Initiating Short Positions
Possible Entry Signal That's Already Forming
Even in the choppy world of currency trading, things can get interesting when two trend lines break in quick succession, especially when one was a downside break and the other was to the upside. That’s precisely what has happened on the GBPCAD four-hour chart (see below).
Guest Commentary: Double Trend Line Break in GBP/CAD
The downside breakout can be considered a fake move at this point due to the upward spike in momentum. As a result, the question remains whether the upside move is true or false. Two possibilities are marked on the chart, one where price returns to test support before shooting up, and the other where price returns to test support before going further down.
Before either scenario develops, however, the price pullback to support is a reasonable move to trade. If price continues to the down side, then we will have entered at the top of the right shoulder in a classic head-and-shoulder pattern.
If price bounces, the trade will still be able to make some money. However, due to the relatively small size of the pattern, lower time frames will be needed.
The hourly chart below presents a clear zone of resistance based on previous consolidations. There is one factor going against this trade, however, and that is the rising momentum in price. Nonetheless, this is a legitimate resistance area, and one that can be traded—and managed—accordingly.
Guest Commentary: Key Resistance Zone for GBP/CAD
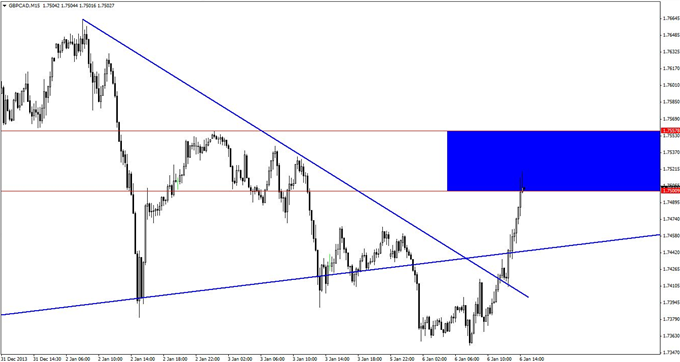
The 15-minute chart below is the trigger chart, in this case, and the usual entry signals will apply: pin bars, bearish engulfing patterns, and/or bearish reversal divergence.
Guest Commentary: GBP/CAD Entry Signal That’s Forming Already
A pin bar has already formed at this point, and a break of the pin bar low would constitute a valid entry signal. It may or may not work the first time, so the usual two or three tries at the entry may be necessary.
By Kaye Lee, private fund trader and head trader consultant, StraightTalkTrading.com
DailyFX provides forex news and technical analysis on the trends that influence the global currency markets.
Learn forex trading with a free practice account and trading charts from FXCM.


