FBL Financial Group Shareholders Have Enjoyed A 60% Share Price Gain

Generally speaking the aim of active stock picking is to find companies that provide returns that are superior to the market average. And while active stock picking involves risks (and requires diversification) it can also provide excess returns. To wit, the FBL Financial Group share price has climbed 60% in five years, easily topping the market return of 39% (ignoring dividends). However, more recent returns haven’t been as impressive as that, with the stock returning just 5.4% in the last year, including dividends.
See our latest analysis for FBL Financial Group
To paraphrase Benjamin Graham: Over the short term the market is a voting machine, but over the long term it’s a weighing machine. One flawed but reasonable way to assess how sentiment around a company has changed is to compare the earnings per share (EPS) with the share price.
FBL Financial Group’s earnings per share are down 2.4% per year, despite strong share price performance over five years. By glancing at these numbers, we’d posit that the decline in earnings per share is not representative of how the business has changed over the years. Since the change in EPS doesn’t seem to correlate with the change in share price, it’s worth taking a look at other metrics.
In fact, the dividend has increased over time, which is a positive. Maybe dividend investors have helped support the share price.
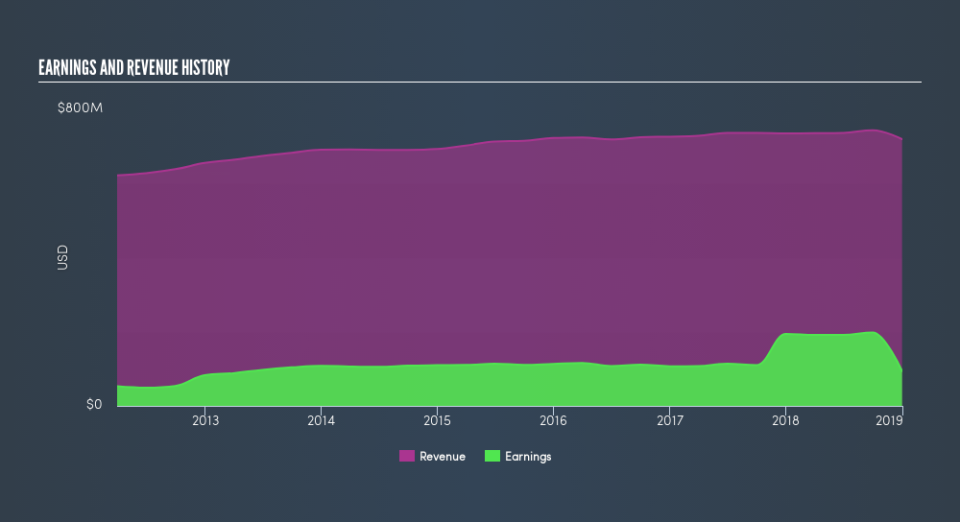
Depicted in the graphic below, you’ll see revenue and earnings over time. If you want more detail, you can click on the chart itself.
If you are thinking of buying or selling FBL Financial Group stock, you should check out this FREE detailed report on its balance sheet.
What About Dividends?
It is important to consider the total shareholder return, as well as the share price return, for any given stock. The TSR is a return calculation that accounts for the value of cash dividends (assuming that any dividend received was reinvested) and the calculated value of any discounted capital raisings. It’s fair to say that the TSR gives a more complete picture for stocks that pay a dividend. In the case of FBL Financial Group, it has a TSR of 105% for the last 5 years. That exceeds its share price return that we previously mentioned. And there’s no prize for guessing that the dividend payments largely explain the divergence!
A Different Perspective
FBL Financial Group’s TSR for the year was broadly in line with the market average, at 5.4%. We should note here that the five-year TSR is more impressive, at 15% per year. Although the share price growth has slowed, the longer term story points to a business well worth watching. Importantly, we haven’t analysed FBL Financial Group’s dividend history. This free visual report on its dividends is a must-read if you’re thinking of buying.
But note: FBL Financial Group may not be the best stock to buy. So take a peek at this free list of interesting companies with past earnings growth (and further growth forecast).
Please note, the market returns quoted in this article reflect the market weighted average returns of stocks that currently trade on US exchanges.
We aim to bring you long-term focused research analysis driven by fundamental data. Note that our analysis may not factor in the latest price-sensitive company announcements or qualitative material.
If you spot an error that warrants correction, please contact the editor at editorial-team@simplywallst.com. This article by Simply Wall St is general in nature. It does not constitute a recommendation to buy or sell any stock, and does not take account of your objectives, or your financial situation. Simply Wall St has no position in the stocks mentioned. Thank you for reading.
