Fentura Financial, Inc. Announces Third Quarter 2021 Earnings
Dollars in thousands except per share amounts. Certain items in the prior period financial statements have been reclassified to conform with the September 30, 2021 presentation.
Figure 1
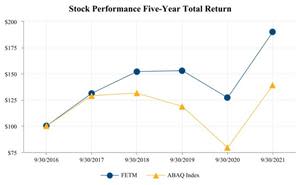
Stock Performance Five-Year Total Return
FENTON, Mich., Nov. 01, 2021 (GLOBE NEWSWIRE) -- Fentura Financial, Inc. (OTCQX: FETM) announces quarterly results of net income of $3,855 and $13,237 for the three and nine month periods ended September 30, 2021.
Ronald Justice, President and CEO, stated "I am extremely pleased by our team's tremendous efforts which continue to generate strong operating results. While residential mortgage activity has been trending downward, overall closings and pipelines remain at historically high levels. Additionally, our commercial lending team has done a tremendous job of developing new relationships and expanding existing customer relationships. These efforts have led to increases in gross loans (net of PPP loans) of $59,029 and $160,367 since June 30, 2021 and September 30, 2020, respectively. Asset quality metrics remain strong and the vast majority of borrowers who were granted COVID-19 related payment deferrals have resumed regular payments. Our team remains committed to our mission and we are well positioned and optimistic about our future."
Following is a discussion of the Corporation's financial performance as of, and for the three and nine month periods ended September 30, 2021. At the end of this document is a list of abbreviations and acronyms.
Results of Operations
The following table outlines the Corporation's QTD results of operations and provides certain performance measures as of, and for the three month periods ended:
9/30/2021 | 6/30/2021 | 3/31/2021 | 12/31/2020 | 9/30/2020 | |||||||||||||||||
INCOME STATEMENT DATA | |||||||||||||||||||||
Interest income | $ | 11,584 | $ | 11,658 | $ | 11,919 | $ | 11,624 | $ | 12,070 | |||||||||||
Interest expense | 653 | 762 | 676 | 972 | 1,189 | ||||||||||||||||
Net interest income | 10,931 | 10,896 | 11,243 | 10,652 | 10,881 | ||||||||||||||||
Provision for loan losses | (436 | ) | 6 | 212 | 982 | 1,109 | |||||||||||||||
Noninterest income | 2,899 | 4,230 | 3,854 | 4,676 | 5,159 | ||||||||||||||||
Noninterest expenses | 9,453 | 9,222 | 9,031 | 10,971 | 8,218 | ||||||||||||||||
Federal income tax expense | 958 | 1,172 | 1,198 | 642 | 1,377 | ||||||||||||||||
Net income | $ | 3,855 | $ | 4,726 | $ | 4,656 | $ | 2,733 | $ | 5,336 | |||||||||||
PER SHARE | |||||||||||||||||||||
Earnings | $ | 0.84 | $ | 1.02 | $ | 1.00 | $ | 0.58 | $ | 1.14 | |||||||||||
Dividends | $ | 0.080 | $ | 0.080 | $ | 0.080 | $ | 0.075 | $ | 0.075 | |||||||||||
Tangible book value(1) | $ | 26.53 | $ | 25.73 | $ | 24.75 | $ | 23.88 | $ | 23.50 | |||||||||||
Quoted market value | |||||||||||||||||||||
High | $ | 26.25 | $ | 27.40 | $ | 24.75 | $ | 22.25 | $ | 17.99 | |||||||||||
Low | $ | 25.60 | $ | 23.55 | $ | 21.90 | $ | 16.93 | $ | 16.80 | |||||||||||
Close(1) | $ | 25.75 | $ | 26.00 | $ | 23.30 | $ | 22.00 | $ | 16.93 | |||||||||||
PERFORMANCE RATIOS | |||||||||||||||||||||
Return on average assets | 1.16 | % | 1.45 | % | 1.50 | % | 0.84 | % | 1.68 | % | |||||||||||
Return on average shareholders' equity | 12.26 | % | 15.64 | % | 15.86 | % | 9.27 | % | 18.86 | % | |||||||||||
Return on average tangible shareholders' equity | 12.63 | % | 16.12 | % | 16.38 | % | 9.58 | % | 19.54 | % | |||||||||||
Efficiency ratio | 68.35 | % | 60.97 | % | 59.82 | % | 71.57 | % | 51.23 | % | |||||||||||
Yield on earning assets (FTE) | 3.69 | % | 3.79 | % | 4.01 | % | 3.75 | % | 3.97 | % | |||||||||||
Rate on interest bearing liabilities | 0.34 | % | 0.41 | % | 0.37 | % | 0.50 | % | 0.63 | % | |||||||||||
Net interest margin to earning assets (FTE) | 3.48 | % | 3.55 | % | 3.79 | % | 3.44 | % | 3.58 | % | |||||||||||
BALANCE SHEET DATA(1) | |||||||||||||||||||||
Total investment securities | $ | 138,476 | $ | 129,944 | $ | 89,772 | $ | 76,111 | $ | 78,179 | |||||||||||
Gross loans | $ | 1,015,177 | $ | 986,358 | $ | 1,028,117 | $ | 1,066,562 | $ | 1,060,885 | |||||||||||
Total assets | $ | 1,329,300 | $ | 1,309,685 | $ | 1,303,175 | $ | 1,251,446 | $ | 1,284,845 | |||||||||||
Total deposits | $ | 1,144,291 | $ | 1,126,496 | $ | 1,122,508 | $ | 1,071,976 | $ | 1,061,470 | |||||||||||
Borrowed funds | $ | 50,000 | $ | 49,500 | $ | 49,000 | $ | 49,000 | $ | 96,217 | |||||||||||
Total shareholders' equity | $ | 124,809 | $ | 122,986 | $ | 119,360 | $ | 115,868 | $ | 114,081 | |||||||||||
Net loans to total deposits | 87.80 | % | 86.60 | % | 90.60 | % | 98.48 | % | 98.99 | % | |||||||||||
Common shares outstanding | 4,569,955 | 4,638,614 | 4,673,932 | 4,694,275 | 4,691,142 | ||||||||||||||||
QTD BALANCE SHEET AVERAGES | |||||||||||||||||||||
Total assets | $ | 1,323,912 | $ | 1,309,942 | $ | 1,259,119 | $ | 1,288,199 | $ | 1,264,105 | |||||||||||
Earning assets | $ | 1,248,018 | $ | 1,234,827 | $ | 1,206,411 | $ | 1,235,895 | $ | 1,210,274 | |||||||||||
Interest bearing liabilities | $ | 756,545 | $ | 753,706 | $ | 735,159 | $ | 773,132 | $ | 750,281 | |||||||||||
Total shareholders' equity | $ | 124,720 | $ | 121,235 | $ | 119,034 | $ | 117,263 | $ | 112,565 | |||||||||||
Total tangible shareholders' equity | $ | 121,120 | $ | 117,567 | $ | 115,298 | $ | 113,444 | $ | 108,655 | |||||||||||
Earned common shares outstanding | 4,582,401 | 4,644,833 | 4,664,893 | 4,682,063 | 4,673,629 | ||||||||||||||||
Unvested stock grants | 20,671 | 20,671 | 21,922 | 14,208 | 14,208 | ||||||||||||||||
Total common shares outstanding | 4,603,072 | 4,665,504 | 4,686,815 | 4,696,271 | 4,687,837 | ||||||||||||||||
ASSET QUALITY(1) | |||||||||||||||||||||
Nonperforming loans to gross loans | 0.82 | % | 0.87 | % | 0.79 | % | 0.75 | % | 0.07 | % | |||||||||||
Nonperforming assets to total assets | 0.63 | % | 0.66 | % | 0.62 | % | 0.64 | % | 0.06 | % | |||||||||||
Allowance for loan losses to gross loans | 1.03 | % | 1.09 | % | 1.08 | % | 1.02 | % | 0.95 | % | |||||||||||
Allowance for loan losses to gross loans, net of PPP loans | 1.04 | % | 1.14 | % | 1.23 | % | 1.23 | % | 1.19 | % | |||||||||||
CAPITAL RATIOS(1) | |||||||||||||||||||||
Total capital to risk weighted assets | 13.63 | % | 14.35 | % | 15.02 | % | 15.14 | % | 15.57 | % | |||||||||||
Tier 1 capital to risk weighted assets | 12.64 | % | 13.27 | % | 13.84 | % | 13.93 | % | 14.40 | % | |||||||||||
CET1 capital to risk weighted assets | 11.33 | % | 11.87 | % | 12.34 | % | 12.38 | % | 12.77 | % | |||||||||||
Tier 1 leverage ratio | 10.21 | % | 10.19 | % | 10.31 | % | 9.80 | % | 9.86 | % | |||||||||||
(1)At end of period | |||||||||||||||||||||
The following table outlines the Corporation's YTD results of operations and provides certain performance measures as of, and for the nine month periods ended:
9/30/2021 | 9/30/2020 | 9/30/2019 | 9/30/2018 | 9/30/2017 | |||||||||||||||||
INCOME STATEMENT DATA | |||||||||||||||||||||
Interest income | $ | 35,161 | $ | 34,355 | $ | 32,465 | $ | 26,419 | $ | 21,246 | |||||||||||
Interest expense | 2,091 | 4,952 | 6,469 | 3,901 | 2,181 | ||||||||||||||||
Net interest income | 33,070 | 29,403 | 25,996 | 22,518 | 19,065 | ||||||||||||||||
Provision for loan losses | (218 | ) | 4,652 | 899 | 767 | 261 | |||||||||||||||
Noninterest income | 10,983 | 14,964 | 6,034 | 6,574 | 6,768 | ||||||||||||||||
Noninterest expenses | 27,706 | 23,713 | 19,808 | 18,403 | 16,418 | ||||||||||||||||
Federal income tax expense | 3,328 | 3,271 | 2,297 | 1,817 | 2,640 | ||||||||||||||||
Net income | $ | 13,237 | $ | 12,731 | $ | 9,026 | $ | 8,105 | $ | 6,514 | |||||||||||
PER SHARE | |||||||||||||||||||||
Earnings | $ | 2.86 | $ | 2.73 | $ | 1.94 | $ | 2.23 | $ | 1.80 | |||||||||||
Dividends | $ | 0.240 | $ | 0.225 | $ | 0.210 | $ | 0.180 | $ | 0.150 | |||||||||||
Tangible book value(1) | $ | 26.53 | $ | 23.50 | $ | 20.37 | $ | 16.91 | $ | 14.29 | |||||||||||
Quoted market value | |||||||||||||||||||||
High | $ | 27.40 | $ | 26.00 | $ | 21.00 | $ | 23.00 | $ | 20.65 | |||||||||||
Low | $ | 21.90 | $ | 12.55 | $ | 20.05 | $ | 18.88 | $ | 15.10 | |||||||||||
Close(1) | $ | 25.75 | $ | 16.93 | $ | 21.00 | $ | 21.15 | $ | 18.45 | |||||||||||
PERFORMANCE RATIOS | |||||||||||||||||||||
Return on average assets | 1.36 | % | 1.45 | % | 1.27 | % | 1.32 | % | 1.21 | % | |||||||||||
Return on average shareholders' equity | 14.55 | % | 15.79 | % | 12.73 | % | 17.29 | % | 16.20 | % | |||||||||||
Return on average tangible shareholders' equity | 15.00 | % | 16.40 | % | 13.35 | % | 18.77 | % | 17.48 | % | |||||||||||
Efficiency ratio | 62.89 | % | 53.45 | % | 61.84 | % | 63.26 | % | 63.55 | % | |||||||||||
Yield on earning assets (FTE) | 3.83 | % | 4.12 | % | 4.81 | % | 4.59 | % | 4.15 | % | |||||||||||
Rate on interest bearing liabilities | 0.37 | % | 0.93 | % | 1.43 | % | 0.98 | % | 0.60 | % | |||||||||||
Net interest margin to earning assets (FTE) | 3.60 | % | 3.52 | % | 3.85 | % | 3.91 | % | 3.72 | % | |||||||||||
BALANCE SHEET DATA(1) | |||||||||||||||||||||
Total investment securities | $ | 138,476 | $ | 78,179 | $ | 62,351 | $ | 79,531 | $ | 67,155 | |||||||||||
Gross loans | $ | 1,015,177 | $ | 1,060,885 | $ | 826,597 | $ | 728,302 | $ | 628,552 | |||||||||||
Total assets | $ | 1,329,300 | $ | 1,284,845 | $ | 978,046 | $ | 909,901 | $ | 756,967 | |||||||||||
Total deposits | $ | 1,144,291 | $ | 1,061,470 | $ | 801,101 | $ | 766,587 | $ | 625,588 | |||||||||||
Borrowed funds | $ | 50,000 | $ | 96,217 | $ | 69,000 | $ | 74,000 | $ | 68,000 | |||||||||||
Total shareholders' equity | $ | 124,809 | $ | 114,081 | $ | 99,142 | $ | 66,340 | $ | 57,161 | |||||||||||
Net loans to total deposits | 87.80 | % | 98.99 | % | 102.51 | % | 94.46 | % | 99.95 | % | |||||||||||
Common shares outstanding | 4,569,955 | 4,691,142 | 4,658,722 | 3,645,402 | 3,631,576 | ||||||||||||||||
YTD BALANCE SHEET AVERAGES | |||||||||||||||||||||
Total assets | $ | 1,297,657 | $ | 1,171,415 | $ | 950,749 | $ | 820,481 | $ | 718,335 | |||||||||||
Earning assets | $ | 1,230,553 | $ | 1,116,861 | $ | 903,192 | $ | 772,111 | $ | 687,175 | |||||||||||
Interest bearing liabilities | $ | 748,472 | $ | 711,449 | $ | 606,912 | $ | 528,165 | $ | 481,657 | |||||||||||
Total shareholders' equity | $ | 121,659 | $ | 107,711 | $ | 94,815 | $ | 62,662 | $ | 53,760 | |||||||||||
Total tangible shareholders' equity | $ | 117,991 | $ | 103,712 | $ | 90,394 | $ | 57,732 | $ | 49,838 | |||||||||||
Earned common shares outstanding | 4,630,709 | 4,665,951 | 4,641,084 | 3,638,123 | 3,618,889 | ||||||||||||||||
Unvested stock grants | 21,088 | 13,966 | 9,907 | — | — | ||||||||||||||||
Total common shares outstanding | 4,651,797 | 4,679,917 | 4,650,991 | 3,638,123 | 3,618,889 | ||||||||||||||||
ASSET QUALITY(1) | |||||||||||||||||||||
Nonperforming loans to gross loans | 0.82 | % | 0.07 | % | 0.11 | % | 0.01 | % | 0.03 | % | |||||||||||
Nonperforming assets to total assets | 0.63 | % | 0.06 | % | 0.09 | % | 0.03 | % | 0.05 | % | |||||||||||
Allowance for loan losses to gross loans | 1.03 | % | 0.95 | % | 0.65 | % | 0.57 | % | 0.52 | % | |||||||||||
Allowance for loan losses to gross loans, net of PPP loans | 1.04 | % | 1.19 | % | 0.65 | % | 0.57 | % | 0.52 | % | |||||||||||
CAPITAL RATIOS(1) | |||||||||||||||||||||
Total capital to risk weighted assets | 13.63 | % | 15.57 | % | 14.42 | % | 11.31 | % | 10.92 | % | |||||||||||
Tier 1 capital to risk weighted assets | 12.64 | % | 14.40 | % | 13.73 | % | 10.73 | % | 10.41 | % | |||||||||||
CET1 capital to risk weighted assets | 11.33 | % | 12.77 | % | 11.96 | % | 8.77 | % | 8.23 | % | |||||||||||
Tier 1 leverage ratio | 10.21 | % | 9.86 | % | 11.22 | % | 8.90 | % | 9.26 | % | |||||||||||
(1)At end of period | |||||||||||||||||||||
Income Statement Breakdown and Analysis
Quarter to Date | |||||||||||||||||||||||||
9/30/2021 | 6/30/2021 | 3/31/2021 | 12/31/2020 | 9/30/2020 | |||||||||||||||||||||
GAAP net income | $ | 3,855 | $ | 4,726 | $ | 4,656 | $ | 2,733 | $ | 5,336 | |||||||||||||||
Acquisition related items (net of tax) | |||||||||||||||||||||||||
Accretion on purchased loans | (152 | ) | (152 | ) | (151 | ) | (82 | ) | (144 | ) | |||||||||||||||
Amortization of core deposit intangibles | 54 | 53 | 54 | 71 | 72 | ||||||||||||||||||||
Amortization on acquired time deposits | 2 | 2 | 2 | 5 | 5 | ||||||||||||||||||||
Other acquisition related expenses | 51 | — | — | — | — | ||||||||||||||||||||
Total acquisition related items (net of tax) | (45 | ) | (97 | ) | (95 | ) | (6 | ) | (67 | ) | |||||||||||||||
Other nonrecurring items (net of tax) | |||||||||||||||||||||||||
FHLB prepayment penalties | — | — | — | 1,507 | — | ||||||||||||||||||||
Change in fair value of equity investment due to acquisition transaction | — | — | — | — | — | ||||||||||||||||||||
Change in fair value of mortgage banking instruments | — | — | — | — | — | ||||||||||||||||||||
Interest writeoff from loan transferred to nonaccrual | — | — | — | 265 | — | ||||||||||||||||||||
Net gain from COLI death benefit | — | — | — | — | — | ||||||||||||||||||||
Prepayment penalties collected | (65 | ) | (33 | ) | (17 | ) | (97 | ) | (16 | ) | |||||||||||||||
Mortgage servicing rights impairment (reduction of impairment) | — | — | — | (188 | ) | (176 | ) | ||||||||||||||||||
Total other nonrecurring items (net of tax) | (65 | ) | (33 | ) | (17 | ) | 1,487 | (192 | ) | ||||||||||||||||
Adjusted net income from operations | $ | 3,745 | $ | 4,596 | $ | 4,544 | $ | 4,214 | $ | 5,077 | |||||||||||||||
GAAP net interest income | $ | 10,931 | $ | 10,896 | $ | 11,243 | $ | 10,652 | $ | 10,881 | |||||||||||||||
Accretion on purchased loans | (192 | ) | (192 | ) | (191 | ) | (104 | ) | (182 | ) | |||||||||||||||
Interest writeoff from loan transferred to nonaccrual | — | — | — | 335 | — | ||||||||||||||||||||
Prepayment penalties collected | (82 | ) | (42 | ) | (21 | ) | (123 | ) | (20 | ) | |||||||||||||||
Amortization on acquired time deposits | 3 | 3 | 3 | 6 | 6 | ||||||||||||||||||||
Adjusted net interest income | $ | 10,660 | $ | 10,665 | $ | 11,034 | $ | 10,766 | $ | 10,685 | |||||||||||||||
PERFORMANCE RATIOS | |||||||||||||||||||||||||
Based on adjusted net income from operations | |||||||||||||||||||||||||
Earnings per share | $ | 0.82 | $ | 0.99 | $ | 0.97 | $ | 0.90 | $ | 1.09 | |||||||||||||||
Return on average assets | 1.12 | % | 1.41 | % | 1.46 | % | 1.30 | % | 1.60 | % | |||||||||||||||
Return on average shareholders' equity | 11.91 | % | 15.21 | % | 15.48 | % | 14.30 | % | 17.94 | % | |||||||||||||||
Return on average tangible shareholders' equity | 12.27 | % | 15.68 | % | 15.98 | % | 14.78 | % | 18.59 | % | |||||||||||||||
Efficiency ratio | 68.74 | % | 61.46 | % | 60.20 | % | 59.02 | % | 52.03 | % | |||||||||||||||
Based on adjusted net interest income | |||||||||||||||||||||||||
Yield on earning assets (FTE) | 3.60 | % | 3.72 | % | 3.94 | % | 3.78 | % | 3.91 | % | |||||||||||||||
Rate on interest bearing liabilities | 0.34 | % | 0.41 | % | 0.37 | % | 0.50 | % | 0.63 | % | |||||||||||||||
Net interest margin to earning assets (FTE) | 3.39 | % | 3.47 | % | 3.71 | % | 3.47 | % | 3.52 | % | |||||||||||||||
Year to Date September 30 | Variance | ||||||||||||||||||
2021 | 2020 | Amount | % | ||||||||||||||||
GAAP net income | $ | 13,237 | $ | 12,731 | $ | 506 | 3.97 | % | |||||||||||
Acquisition related items (net of tax) | |||||||||||||||||||
Accretion on purchased loans | (455 | ) | (434 | ) | (21 | ) | 4.84 | % | |||||||||||
Amortization of core deposit intangibles | 161 | 214 | (53 | ) | (24.77 | ) | % | ||||||||||||
Amortization on acquired time deposits | 6 | 13 | (7 | ) | (53.85 | ) | % | ||||||||||||
Other acquisition related expenses | 51 | — | 51 | N/M | |||||||||||||||
Total acquisition related items (net of tax) | (237 | ) | (207 | ) | (30 | ) | 14.49 | % | |||||||||||
Other nonrecurring items (net of tax) | |||||||||||||||||||
FHLB prepayment penalties | — | — | — | — | % | ||||||||||||||
Change in fair value of equity investment due to acquisition transaction | — | (578 | ) | 578 | (100.00 | ) | % | ||||||||||||
Change in fair value of mortgage banking instruments | — | (448 | ) | 448 | (100.00 | ) | % | ||||||||||||
Interest writeoff from loan transferred to nonaccrual | — | — | — | — | % | ||||||||||||||
Net gain from COLI death benefit | — | (173 | ) | 173 | (100.00 | ) | % | ||||||||||||
Prepayment penalties collected | (115 | ) | (64 | ) | (51 | ) | 79.69 | % | |||||||||||
Mortgage servicing rights impairment (reduction of impairment) | — | 188 | (188 | ) | (100.00 | ) | % | ||||||||||||
Total other nonrecurring items (net of tax) | (115 | ) | (1,075 | ) | 960 | (89.30 | ) | % | |||||||||||
Adjusted net income from operations | $ | 12,885 | $ | 11,449 | $ | 1,436 | 12.54 | % | |||||||||||
GAAP net interest income | $ | 33,070 | $ | 29,403 | $ | 3,667 | 12.47 | % | |||||||||||
Accretion on purchased loans | (575 | ) | (549 | ) | (26 | ) | 4.74 | % | |||||||||||
Interest writeoff from loan transferred to nonaccrual | — | — | — | — | % | ||||||||||||||
Prepayment penalties collected | (145 | ) | (81 | ) | (64 | ) | 79.01 | % | |||||||||||
Amortization on acquired time deposits | 9 | 17 | (8 | ) | (47.06 | ) | % | ||||||||||||
Adjusted net interest income | $ | 32,359 | $ | 28,790 | $ | 3,569 | 12.40 | % | |||||||||||
PERFORMANCE RATIOS | |||||||||||||||||||
Based on adjusted net income from operations | |||||||||||||||||||
Earnings per share | $ | 2.78 | $ | 2.45 | $ | 0.33 | 13.47 | % | |||||||||||
Return on average assets | 1.33 | % | 1.31 | % | 0.02 | % | |||||||||||||
Return on average shareholders' equity | 14.16 | % | 14.20 | % | (0.04 | ) | % | ||||||||||||
Return on average tangible shareholders' equity | 14.60 | % | 14.75 | % | (0.15 | ) | % | ||||||||||||
Efficiency ratio | 63.31 | % | 55.13 | % | 8.18 | % | |||||||||||||
Based on adjusted net interest income | |||||||||||||||||||
Yield on earning assets (FTE) | 3.75 | % | 4.04 | % | (0.29 | ) | % | ||||||||||||
Rate on interest bearing liabilities | 0.37 | % | 0.93 | % | (0.56 | ) | % | ||||||||||||
Net interest margin to earning assets (FTE) | 3.52 | % | 3.45 | % | 0.07 | % | |||||||||||||
Average Balances, Interest Rate, and Net Interest Income
The following tables present the daily average amount outstanding for each major category of interest earning assets, nonearning assets, interest bearing liabilities, and noninterest bearing liabilities. These tables also present an analysis of interest income and interest expense for the periods indicated. All interest income is reported on a FTE basis using a federal income tax rate of 21%. Loans in nonaccrual status, for the purpose of the following computations, are included in the average loan balances.
Net interest income is the amount by which interest income on earning assets exceeds the interest expenses on interest bearing liabilities. Net interest income, which includes loan fees, is influenced by changes in the balance and mix of assets and liabilities and market interest rates. The Corporation exerts some control over these factors; however, FRB monetary policy and competition have a significant impact. For analytical purposes, net interest income is adjusted to a FTE basis by adding the income tax savings from interest on tax exempt loans, and nontaxable investment securities, thus making period-to-period comparisons more meaningful.
Three Months Ended | ||||||||||||||||||||||||||||||||||||
September 30, 2021 | June 30, 2021 | September 30, 2020 | ||||||||||||||||||||||||||||||||||
Average | Tax | Average | Average | Tax | Average | Average | Tax | Average | ||||||||||||||||||||||||||||
Interest earning assets | ||||||||||||||||||||||||||||||||||||
Total loans | $ | 1,000,660 | $ | 11,076 | 4.39 | % | $ | 1,023,620 | $ | 11,220 | 4.40 | % | $ | 1,086,629 | $ | 11,701 | 4.28 | % | ||||||||||||||||||
Taxable investment securities | 113,868 | 372 | 1.30 | % | 89,467 | 322 | 1.44 | % | 62,490 | 256 | 1.63 | % | ||||||||||||||||||||||||
Nontaxable investment securities | 17,085 | 95 | % | |||||||||||||||||||||||||||||||||
