What Is Ferrexpo's (LON:FXPO) P/E Ratio After Its Share Price Tanked?

To the annoyance of some shareholders, Ferrexpo (LON:FXPO) shares are down a considerable 31% in the last month. Indeed the recent decline has arguably caused some bitterness for shareholders who have held through the 37% drop over twelve months.
Assuming nothing else has changed, a lower share price makes a stock more attractive to potential buyers. In the long term, share prices tend to follow earnings per share, but in the short term prices bounce around in response to short term factors (which are not always obvious). So, on certain occasions, long term focussed investors try to take advantage of pessimistic expectations to buy shares at a better price. Perhaps the simplest way to get a read on investors' expectations of a business is to look at its Price to Earnings Ratio (PE Ratio). Investors have optimistic expectations of companies with higher P/E ratios, compared to companies with lower P/E ratios.
See our latest analysis for Ferrexpo
How Does Ferrexpo's P/E Ratio Compare To Its Peers?
Ferrexpo's P/E of 2.34 indicates relatively low sentiment towards the stock. We can see in the image below that the average P/E (8.7) for companies in the metals and mining industry is higher than Ferrexpo's P/E.
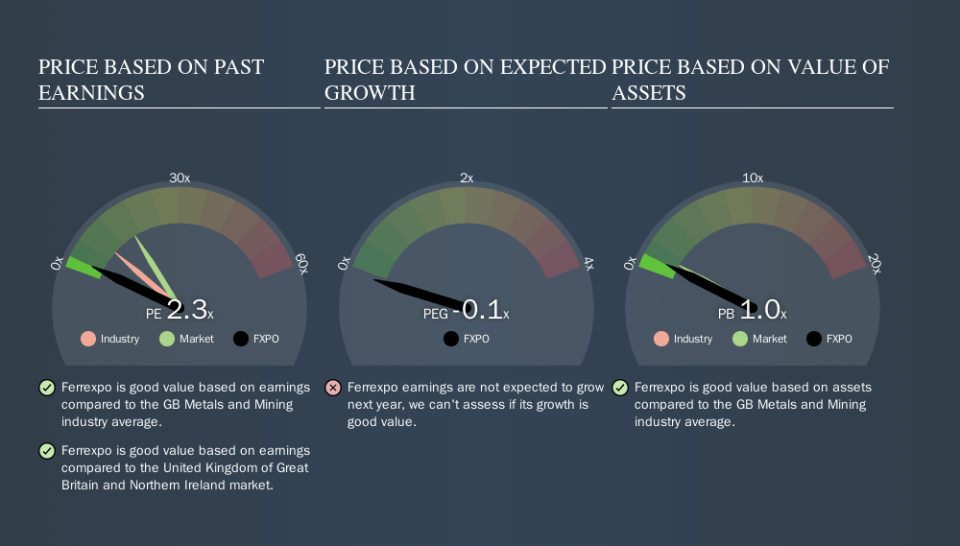
Ferrexpo's P/E tells us that market participants think it will not fare as well as its peers in the same industry. While current expectations are low, the stock could be undervalued if the situation is better than the market assumes. You should delve deeper. I like to check if company insiders have been buying or selling.
How Growth Rates Impact P/E Ratios
Earnings growth rates have a big influence on P/E ratios. That's because companies that grow earnings per share quickly will rapidly increase the 'E' in the equation. That means even if the current P/E is high, it will reduce over time if the share price stays flat. And as that P/E ratio drops, the company will look cheap, unless its share price increases.
Notably, Ferrexpo grew EPS by a whopping 37% in the last year. And earnings per share have improved by 5.8% annually, over the last five years. With that performance, I would expect it to have an above average P/E ratio.
A Limitation: P/E Ratios Ignore Debt and Cash In The Bank
The 'Price' in P/E reflects the market capitalization of the company. So it won't reflect the advantage of cash, or disadvantage of debt. In theory, a company can lower its future P/E ratio by using cash or debt to invest in growth.
Spending on growth might be good or bad a few years later, but the point is that the P/E ratio does not account for the option (or lack thereof).
How Does Ferrexpo's Debt Impact Its P/E Ratio?
Net debt is 26% of Ferrexpo's market cap. You'd want to be aware of this fact, but it doesn't bother us.
The Bottom Line On Ferrexpo's P/E Ratio
Ferrexpo has a P/E of 2.3. That's below the average in the GB market, which is 16.4. The company does have a little debt, and EPS growth was good last year. If the company can continue to grow earnings, then the current P/E may be unjustifiably low. Given Ferrexpo's P/E ratio has declined from 3.4 to 2.3 in the last month, we know for sure that the market is more worried about the business today, than it was back then. For those who prefer invest in growth, this stock apparently offers limited promise, but the deep value investors may find the pessimism around this stock enticing.
Investors have an opportunity when market expectations about a stock are wrong. If the reality for a company is not as bad as the P/E ratio indicates, then the share price should increase as the market realizes this. So this free visualization of the analyst consensus on future earnings could help you make the right decision about whether to buy, sell, or hold.
You might be able to find a better buy than Ferrexpo. If you want a selection of possible winners, check out this free list of interesting companies that trade on a P/E below 20 (but have proven they can grow earnings).
We aim to bring you long-term focused research analysis driven by fundamental data. Note that our analysis may not factor in the latest price-sensitive company announcements or qualitative material.
If you spot an error that warrants correction, please contact the editor at editorial-team@simplywallst.com. This article by Simply Wall St is general in nature. It does not constitute a recommendation to buy or sell any stock, and does not take account of your objectives, or your financial situation. Simply Wall St has no position in the stocks mentioned. Thank you for reading.
