Financial Stocks Flash Buy Signals During Market Pullback
The recent market drawdown has been particularly painful for the financial sector, especially with the Fed lowering interest rates last week. However, this pullback could mark a buying opportunity for some names based on technical data. Two stocks that landed on recent studies done by Schaeffer's Senior Quantitative Analyst Rocky White are PNC Financial Services Group Inc (NYSE:PNC) and Capital One Financial Corp. (NYSE:COF). Let's check in on the shares of PNC and COF.
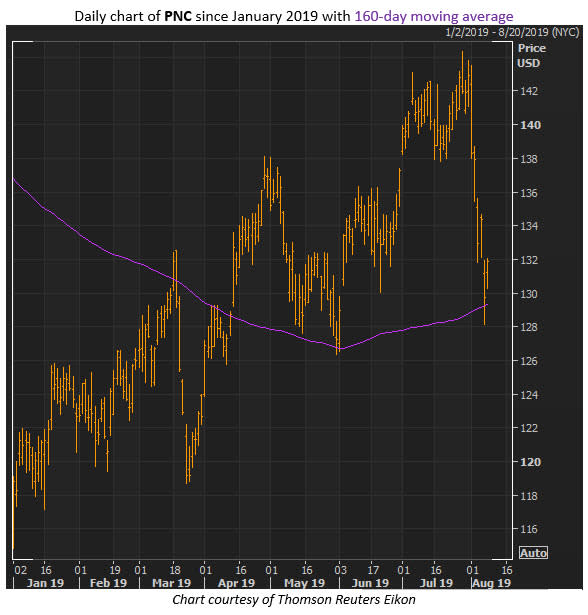
PNC Finds Familiar Chart Support
PNC was last seen up 1.7% at $131.98, as the stock stays in its channel of higher lows during 2019. This most recent pullback, similar to the one in late May, seems to be finding a floor at the 160-day moving average. According to White's data, the last four pullbacks of this type to the moving average have resulted in a 21-day average return of 6.2%, with all the returns positive.
The bank security's options traders don't seem to be positioned for a downside move. This is according to the equity's Schaeffer's put/call open interest ratio (SOIR) of 1.12, which ranks in the 82nd annual percentile. So not only does near-term put open interest outweigh call open interest, but such a setup is highly unusual.
However, those looking to speculate on PNC with options will need to pay up for premiums at the moment. The 30-day at-the-money (ATM) implied volatility (IV) right now is 23.9% and ranks in the 79th annual percentile, hinting at higher-than-normal volatility expectations around the stock at the moment.
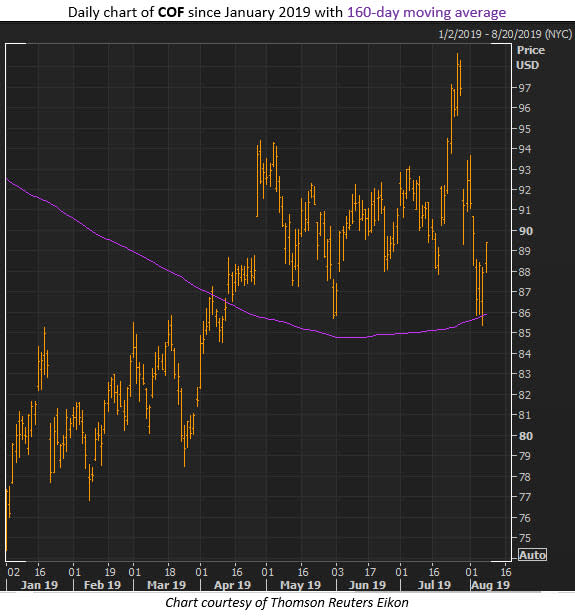
Capital One Shares Signal Potential Comeback
COF shares are also pulling back to the 160-day moving average, which has been a strong level of support in the past. White's study shows an average 21-day return of 5.4% following the previous five signals, and all five have produced positive returns. The stock has dropped 9% in roughly the past two weeks, due in part to the company's massive data hack.
Near-term traders are also put-skewed on Capital One, but that's the norm, since the SOIR of 1.13 ranks in just the 38th annual percentile. In today's trading, the September 90 put is seeing the most activity, where positions are likely being closed, especially since this strike was home to heavy open interest coming into today. There are new positions opening, meanwhile, at the August 91 call.
As for other notable options data, the Schaeffer's Volatility Scorecard (SVS) for COF comes in at 24. Said in simpler terms, this reading shows a tendency to make smaller moves than options traders were expecting during the past year.
