How Financially Strong Is Enterprise Group Inc (TSE:E)?

While small-cap stocks, such as Enterprise Group Inc (TSE:E) with its market cap of CA$24.26m, are popular for their explosive growth, investors should also be aware of their balance sheet to judge whether the company can survive a downturn. Given that E is not presently profitable, it’s crucial to evaluate the current state of its operations and pathway to profitability. Here are few basic financial health checks you should consider before taking the plunge. Nevertheless, given that I have not delve into the company-specifics, I’d encourage you to dig deeper yourself into E here.
How does E’s operating cash flow stack up against its debt?
Over the past year, E has reduced its debt from CA$24.25m to CA$6.26m , which comprises of short- and long-term debt. With this debt repayment, E currently has CA$892.58k remaining in cash and short-term investments , ready to deploy into the business. On top of this, E has produced CA$5.63m in operating cash flow during the same period of time, leading to an operating cash to total debt ratio of 89.99%, indicating that E’s debt is appropriately covered by operating cash. This ratio can also be a sign of operational efficiency for unprofitable companies since metrics such as return on asset (ROA) requires a positive net income. In E’s case, it is able to generate 0.9x cash from its debt capital.
Can E meet its short-term obligations with the cash in hand?
Looking at E’s most recent CA$2.58m liabilities, it appears that the company has been able to meet these obligations given the level of current assets of CA$12.83m, with a current ratio of 4.98x. Though, a ratio greater than 3x may be considered as too high, as E could be holding too much capital in a low-return investment environment.
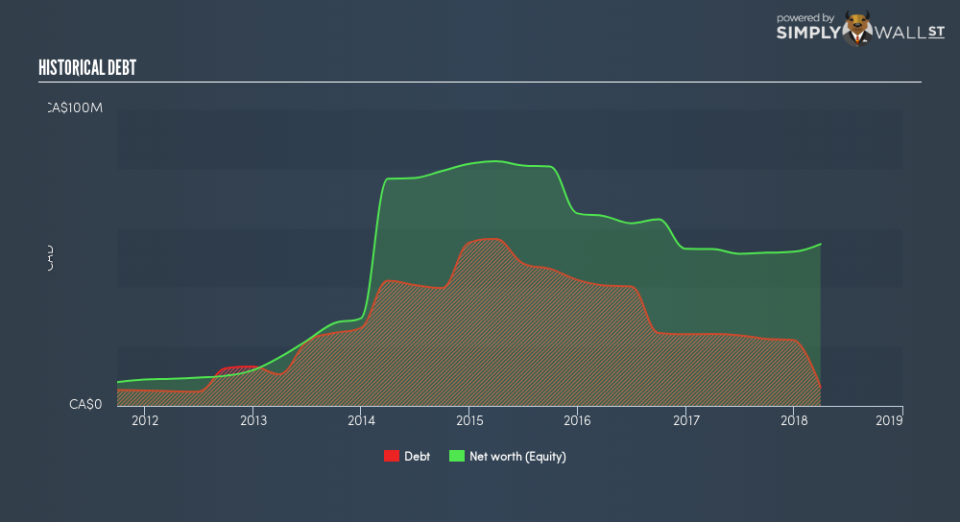
Does E face the risk of succumbing to its debt-load?
With debt at 11.47% of equity, E may be thought of as appropriately levered. This range is considered safe as E is not taking on too much debt obligation, which may be constraining for future growth. Risk around debt is very low for E, and the company also has the ability and headroom to increase debt if needed going forward.
Next Steps:
E has demonstrated its ability to generate sufficient levels of cash flow, while its debt hovers at a safe level. Furthermore, the company exhibits an ability to meet its near term obligations should an adverse event occur. I admit this is a fairly basic analysis for E’s financial health. Other important fundamentals need to be considered alongside. I recommend you continue to research Enterprise Group to get a more holistic view of the stock by looking at:
Valuation: What is E worth today? Is the stock undervalued, even when its growth outlook is factored into its intrinsic value? The intrinsic value infographic in our free research report helps visualize whether E is currently mispriced by the market.
Historical Performance: What has E’s returns been like over the past? Go into more detail in the past track record analysis and take a look at the free visual representations of our analysis for more clarity.
Other High-Performing Stocks: Are there other stocks that provide better prospects with proven track records? Explore our free list of these great stocks here.
To help readers see past the short term volatility of the financial market, we aim to bring you a long-term focused research analysis purely driven by fundamental data. Note that our analysis does not factor in the latest price-sensitive company announcements.
The author is an independent contributor and at the time of publication had no position in the stocks mentioned. For errors that warrant correction please contact the editor at editorial-team@simplywallst.com.
