Financially Strong And High Value Stocks

Globe International and Harvey Norman Holdings may be trading at prices below their likely values. This suggests that these stocks are undervalued, meaning we can benefit when the stock price moves to its true valuation. Investors can profit from the difference by investing in these stocks as the current market prices should eventually move towards their true values. If capital gains are what you’re after in your next investment, I’ve put together a list of undervalued stocks you may be interested in, based on the latest financial data from each company.
Globe International Limited (ASX:GLB)
Globe International Limited produces and distributes purpose-built apparel, footwear, and skateboard hardgoods for the board sports, street fashion, and workwear markets. Globe International was started in 1984 and has a market cap of AUD A$49.55M, putting it in the small-cap category.
GLB’s shares are now floating at around -79% below its real value of $5.78, at the market price of $1.2, based on my discounted cash flow model. signalling an opportunity to buy the stock at a low price. Furthermore, GLB’s PE ratio stands at 9.8x relative to its textiles, apparel and luxury goods peer level of 12.8x, suggesting that relative to its peers, we can invest in GLB at a lower price. GLB is also a financially healthy company, with short-term assets covering liabilities in the near future as well as in the long run. GLB has zero debt on its books as well, meaning it has no long term debt obligations to worry about.

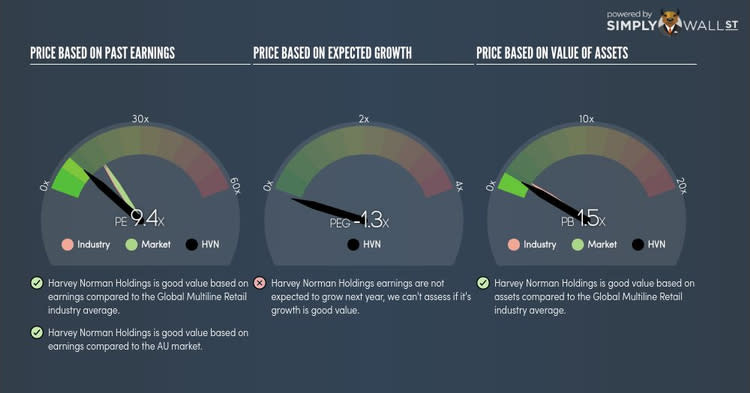
Harvey Norman Holdings Limited (ASX:HVN)
Harvey Norman Holdings Limited grants franchises to independent business proprietors. Formed in 1982, and now led by CEO Kay Page, the company currently employs 5,200 people and with the market cap of AUD A$4.21B, it falls under the mid-cap stocks category.
HVN’s stock is now trading at -21% beneath its intrinsic value of $4.76, at the market price of $3.78, based on my discounted cash flow model. This mismatch indicates a chance to invest in HVN at a discounted price. Furthermore, HVN’s PE ratio is trading at around 9.4x while its multiline retail peer level trades at 15.6x, indicating that relative to its competitors, we can purchase HVN’s shares for cheaper. HVN is also a financially robust company, as current assets can cover liabilities in the near term and over the long run. Finally, its debt relative to equity is 26%, which has been falling for the past few years signifying its capability to reduce its debt obligations year on year.
Waterco Limited (ASX:WAT)
Waterco Limited engages in the manufacture and wholesale of equipment and accessories in the swimming pool, spa pool, spa bath, rural pump, and water treatment industries in Australia. Established in 1981, and run by CEO Soon Sinn Goh, the company now has 593 employees and with the company’s market cap sitting at AUD A$63.55M, it falls under the small-cap group.
WAT’s stock is now trading at -47% beneath its real value of $3.19, at a price tag of $1.7, according to my discounted cash flow model. This mismatch signals an opportunity to buy WAT shares at a discount. Also, WAT’s PE ratio is currently around 17.6x compared to its leisure products peer level of 18.1x, suggesting that relative to its peers, you can purchase WAT’s stock for a lower price right now. WAT is also strong in terms of its financial health, with current assets covering liabilities in the near term and over the long run. The stock’s debt-to equity ratio of 28% has been falling over time, showing its ability to reduce its debt obligations year on year.

For more financially sound, undervalued companies to add to your portfolio, you can use our free platform to explore our interactive list of undervalued stocks.
To help readers see pass the short term volatility of the financial market, we aim to bring you a long-term focused research analysis purely driven by fundamental data. Note that our analysis does not factor in the latest price sensitive company announcements.
The author is an independent contributor and at the time of publication had no position in the stocks mentioned.
