How Financially Strong Is Medidata Solutions Inc (NASDAQ:MDSO)?

Small-caps and large-caps are wildly popular among investors; however, mid-cap stocks, such as Medidata Solutions Inc (NASDAQ:MDSO) with a market-capitalization of US$4.88b, rarely draw their attention. Despite this, the two other categories have lagged behind the risk-adjusted returns of commonly ignored mid-cap stocks. MDSO’s financial liquidity and debt position will be analysed in this article, to get an idea of whether the company can fund opportunities for strategic growth and maintain strength through economic downturns. Note that this information is centred entirely on financial health and is a top-level understanding, so I encourage you to look further into MDSO here. Check out our latest analysis for Medidata Solutions
Does MDSO produce enough cash relative to debt?
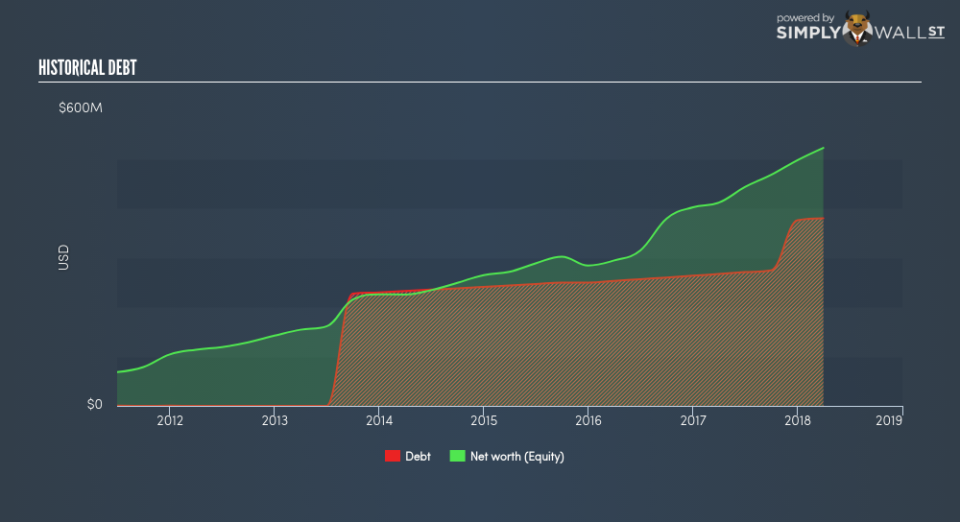
MDSO has built up its total debt levels in the last twelve months, from US$263.40m to US$0 , which comprises of short- and long-term debt. With this rise in debt, MDSO’s cash and short-term investments stands at US$484.29m for investing into the business. Moreover, MDSO has generated US$121.75m in operating cash flow over the same time period, leading to an operating cash to total debt ratio of 32.38%, meaning that MDSO’s debt is appropriately covered by operating cash. This ratio can also be interpreted as a measure of efficiency as an alternative to return on assets. In MDSO’s case, it is able to generate 0.32x cash from its debt capital.
Can MDSO meet its short-term obligations with the cash in hand?
Looking at MDSO’s most recent US$429.12m liabilities, it appears that the company has been able to meet these obligations given the level of current assets of US$637.62m, with a current ratio of 1.49x. For Healthcare Services companies, this ratio is within a sensible range since there is a bit of a cash buffer without leaving too much capital in a low-return environment.
Does MDSO face the risk of succumbing to its debt-load?
With debt reaching 72.74% of equity, MDSO may be thought of as relatively highly levered. This is not uncommon for a mid-cap company given that debt tends to be lower-cost and at times, more accessible. No matter how high the company’s debt, if it can easily cover the interest payments, it’s considered to be efficient with its use of excess leverage. A company generating earnings after interest and tax at least three times its net interest payments is considered financially sound. In MDSO’s case, the ratio of 4.87x suggests that interest is appropriately covered, which means that lenders may be less hesitant to lend out more funding as MDSO’s high interest coverage is seen as responsible and safe practice.
Next Steps:
MDSO’s high cash coverage means that, although its debt levels are high, the company is able to utilise its borrowings efficiently in order to generate cash flow. Since there is also no concerns around MDSO’s liquidity needs, this may be its optimal capital structure for the time being. This is only a rough assessment of financial health, and I’m sure MDSO has company-specific issues impacting its capital structure decisions. You should continue to research Medidata Solutions to get a more holistic view of the mid-cap by looking at:
Future Outlook: What are well-informed industry analysts predicting for MDSO’s future growth? Take a look at our free research report of analyst consensus for MDSO’s outlook.
Valuation: What is MDSO worth today? Is the stock undervalued, even when its growth outlook is factored into its intrinsic value? The intrinsic value infographic in our free research report helps visualize whether MDSO is currently mispriced by the market.
Other High-Performing Stocks: Are there other stocks that provide better prospects with proven track records? Explore our free list of these great stocks here.
To help readers see pass the short term volatility of the financial market, we aim to bring you a long-term focused research analysis purely driven by fundamental data. Note that our analysis does not factor in the latest price sensitive company announcements.
The author is an independent contributor and at the time of publication had no position in the stocks mentioned.
