Is Finning International Inc’s (TSE:FTT) 11.89% ROE Strong Compared To Its Industry?

The content of this article will benefit those of you who are starting to educate yourself about investing in the stock market and want to start learning about core concepts of fundamental analysis on practical examples from today’s market.
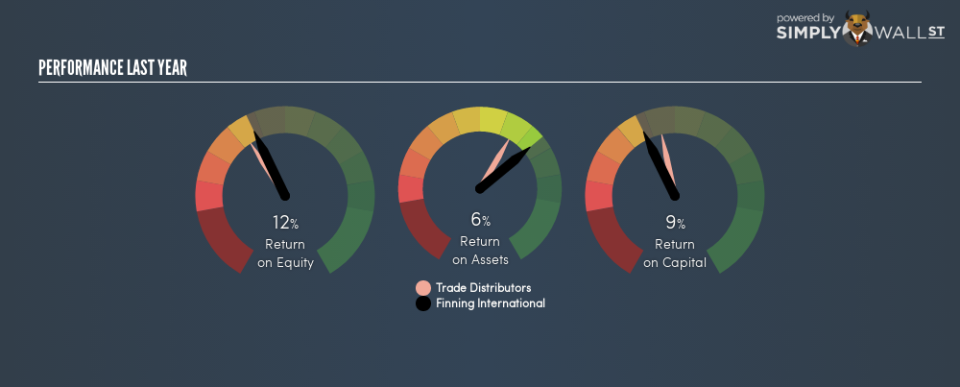
With an ROE of 11.89%, Finning International Inc (TSE:FTT) outpaced its own industry which delivered a less exciting 10.68% over the past year. While the impressive ratio tells us that FTT has made significant profits from little equity capital, ROE doesn’t tell us if FTT has borrowed debt to make this happen. We’ll take a closer look today at factors like financial leverage to determine whether FTT’s ROE is actually sustainable.
View our latest analysis for Finning International
What you must know about ROE
Return on Equity (ROE) weighs Finning International’s profit against the level of its shareholders’ equity. For example, if the company invests CA$1 in the form of equity, it will generate CA$0.12 in earnings from this. In most cases, a higher ROE is preferred; however, there are many other factors we must consider prior to making any investment decisions.
Return on Equity = Net Profit ÷ Shareholders Equity
Returns are usually compared to costs to measure the efficiency of capital. Finning International’s cost of equity is 11.23%. This means Finning International returns enough to cover its own cost of equity, with a buffer of 0.67%. This sustainable practice implies that the company pays less for its capital than what it generates in return. ROE can be dissected into three distinct ratios: net profit margin, asset turnover, and financial leverage. This is called the Dupont Formula:
Dupont Formula
ROE = profit margin × asset turnover × financial leverage
ROE = (annual net profit ÷ sales) × (sales ÷ assets) × (assets ÷ shareholders’ equity)
ROE = annual net profit ÷ shareholders’ equity
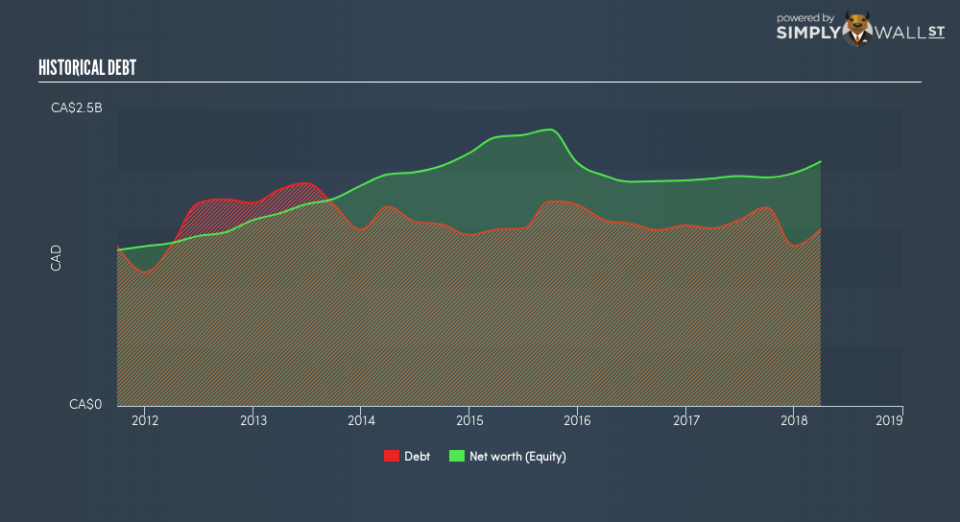
Essentially, profit margin shows how much money the company makes after paying for all its expenses. The other component, asset turnover, illustrates how much revenue Finning International can make from its asset base. The most interesting ratio, and reflective of sustainability of its ROE, is financial leverage. Since ROE can be inflated by excessive debt, we need to examine Finning International’s debt-to-equity level. At 72.38%, Finning International’s debt-to-equity ratio appears sensible and indicates the above-average ROE is generated from its capacity to increase profit without a large debt burden.
Next Steps:
ROE is a simple yet informative ratio, illustrating the various components that each measure the quality of the overall stock. Finning International’s above-industry ROE is encouraging, and is also in excess of its cost of equity. Its high ROE is not likely to be driven by high debt. Therefore, investors may have more confidence in the sustainability of this level of returns going forward. Although ROE can be a useful metric, it is only a small part of diligent research.
For Finning International, I’ve put together three essential factors you should further examine:
Financial Health: Does it have a healthy balance sheet? Take a look at our free balance sheet analysis with six simple checks on key factors like leverage and risk.
Valuation: What is Finning International worth today? Is the stock undervalued, even when its growth outlook is factored into its intrinsic value? The intrinsic value infographic in our free research report helps visualize whether Finning International is currently mispriced by the market.
Other High-Growth Alternatives : Are there other high-growth stocks you could be holding instead of Finning International? Explore our interactive list of stocks with large growth potential to get an idea of what else is out there you may be missing!
To help readers see past the short term volatility of the financial market, we aim to bring you a long-term focused research analysis purely driven by fundamental data. Note that our analysis does not factor in the latest price-sensitive company announcements.
The author is an independent contributor and at the time of publication had no position in the stocks mentioned. For errors that warrant correction please contact the editor at editorial-team@simplywallst.com.
