How First Industrial Realty Trust Inc (NYSE:FR) Delivered A Better ROE Than Its Industry

This article is intended for those of you who are at the beginning of your investing journey and want to start learning about core concepts of fundamental analysis on practical examples from today’s market.
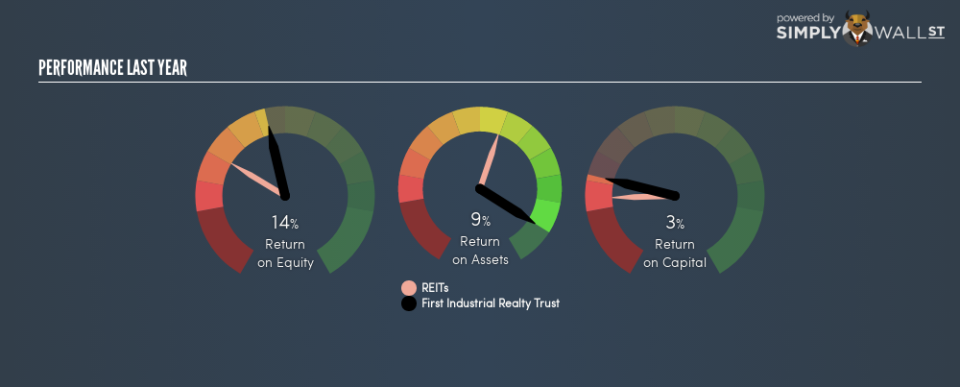
With an ROE of 13.9%, First Industrial Realty Trust Inc (NYSE:FR) outpaced its own industry which delivered a less exciting 6.6% over the past year. While the impressive ratio tells us that FR has made significant profits from little equity capital, ROE doesn’t tell us if FR has borrowed debt to make this happen. In this article, we’ll closely examine some factors like financial leverage to evaluate the sustainability of FR’s ROE.
Check out our latest analysis for First Industrial Realty Trust
Breaking down ROE — the mother of all ratios
Return on Equity (ROE) weighs First Industrial Realty Trust’s profit against the level of its shareholders’ equity. For example, if the company invests $1 in the form of equity, it will generate $0.14 in earnings from this. Generally speaking, a higher ROE is preferred; however, there are other factors we must also consider before making any conclusions.
Return on Equity = Net Profit ÷ Shareholders Equity
Returns are usually compared to costs to measure the efficiency of capital. First Industrial Realty Trust’s cost of equity is 8.6%. This means First Industrial Realty Trust returns enough to cover its own cost of equity, with a buffer of 5.3%. This sustainable practice implies that the company pays less for its capital than what it generates in return. ROE can be split up into three useful ratios: net profit margin, asset turnover, and financial leverage. This is called the Dupont Formula:
Dupont Formula
ROE = profit margin × asset turnover × financial leverage
ROE = (annual net profit ÷ sales) × (sales ÷ assets) × (assets ÷ shareholders’ equity)
ROE = annual net profit ÷ shareholders’ equity
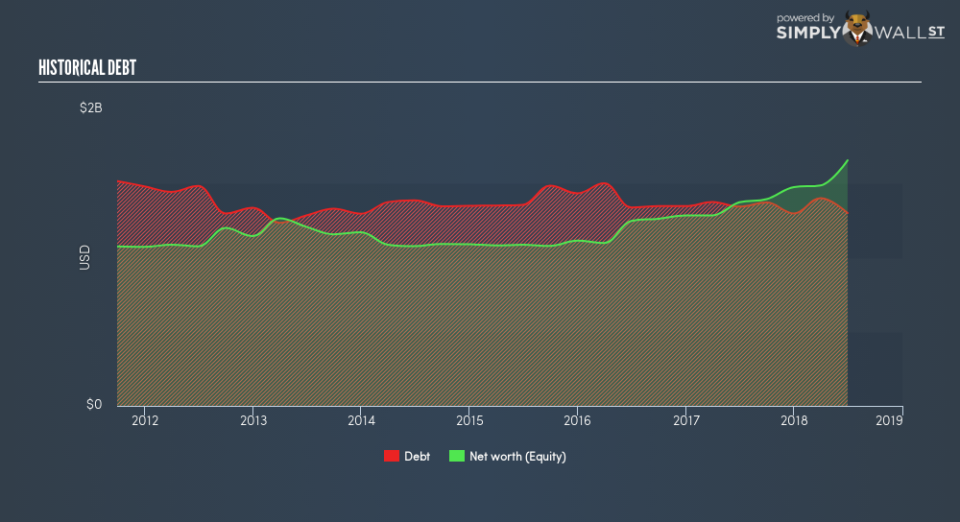
Basically, profit margin measures how much of revenue trickles down into earnings which illustrates how efficient the business is with its cost management. Asset turnover shows how much revenue First Industrial Realty Trust can generate with its current asset base. And finally, financial leverage is simply how much of assets are funded by equity, which exhibits how sustainable the company’s capital structure is. Since ROE can be inflated by excessive debt, we need to examine First Industrial Realty Trust’s debt-to-equity level. The debt-to-equity ratio currently stands at a sensible 78.5%, meaning the above-average ROE is due to its capacity to produce profit growth without a huge debt burden.
Next Steps:
ROE is one of many ratios which meaningfully dissects financial statements, which illustrates the quality of a company. First Industrial Realty Trust exhibits a strong ROE against its peers, as well as sufficient returns to cover its cost of equity. ROE is not likely to be inflated by excessive debt funding, giving shareholders more conviction in the sustainability of high returns. ROE is a helpful signal, but it is definitely not sufficient on its own to make an investment decision.
For First Industrial Realty Trust, there are three pertinent factors you should further research:
Financial Health: Does it have a healthy balance sheet? Take a look at our free balance sheet analysis with six simple checks on key factors like leverage and risk.
Valuation: What is First Industrial Realty Trust worth today? Is the stock undervalued, even when its growth outlook is factored into its intrinsic value? The intrinsic value infographic in our free research report helps visualize whether First Industrial Realty Trust is currently mispriced by the market.
Other High-Growth Alternatives : Are there other high-growth stocks you could be holding instead of First Industrial Realty Trust? Explore our interactive list of stocks with large growth potential to get an idea of what else is out there you may be missing!
To help readers see past the short term volatility of the financial market, we aim to bring you a long-term focused research analysis purely driven by fundamental data. Note that our analysis does not factor in the latest price-sensitive company announcements.
The author is an independent contributor and at the time of publication had no position in the stocks mentioned. For errors that warrant correction please contact the editor at editorial-team@simplywallst.com.
