What Is First Merchants's (NASDAQ:FRME) P/E Ratio After Its Share Price Tanked?

To the annoyance of some shareholders, First Merchants (NASDAQ:FRME) shares are down a considerable 33% in the last month. Indeed the recent decline has arguably caused some bitterness for shareholders who have held through the 30% drop over twelve months.
Assuming nothing else has changed, a lower share price makes a stock more attractive to potential buyers. While the market sentiment towards a stock is very changeable, in the long run, the share price will tend to move in the same direction as earnings per share. So, on certain occasions, long term focussed investors try to take advantage of pessimistic expectations to buy shares at a better price. One way to gauge market expectations of a stock is to look at its Price to Earnings Ratio (PE Ratio). Investors have optimistic expectations of companies with higher P/E ratios, compared to companies with lower P/E ratios.
View our latest analysis for First Merchants
How Does First Merchants's P/E Ratio Compare To Its Peers?
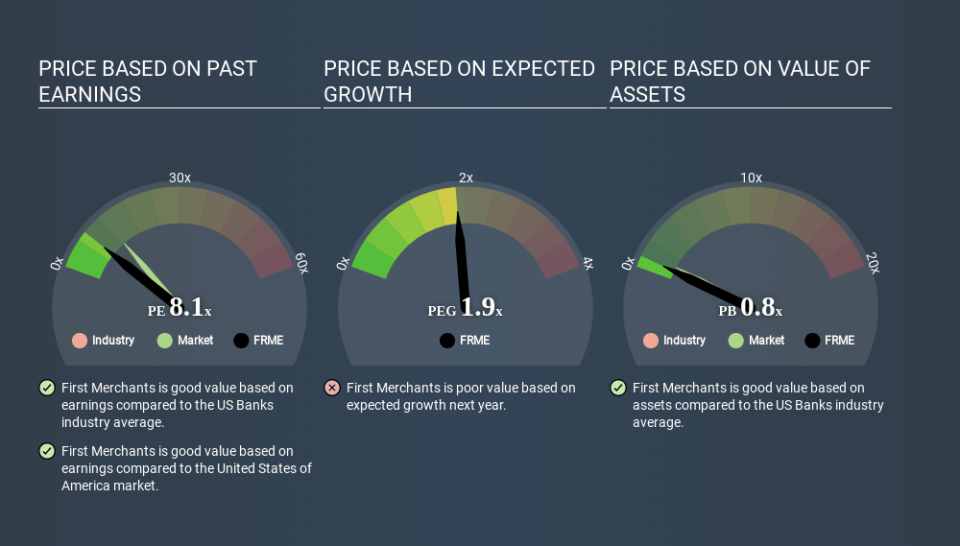
First Merchants's P/E of 8.05 indicates relatively low sentiment towards the stock. If you look at the image below, you can see First Merchants has a lower P/E than the average (9.0) in the banks industry classification.
This suggests that market participants think First Merchants will underperform other companies in its industry. While current expectations are low, the stock could be undervalued if the situation is better than the market assumes. You should delve deeper. I like to check if company insiders have been buying or selling.
How Growth Rates Impact P/E Ratios
Earnings growth rates have a big influence on P/E ratios. That's because companies that grow earnings per share quickly will rapidly increase the 'E' in the equation. Therefore, even if you pay a high multiple of earnings now, that multiple will become lower in the future. A lower P/E should indicate the stock is cheap relative to others -- and that may attract buyers.
First Merchants maintained roughly steady earnings over the last twelve months. But over the longer term (5 years) earnings per share have increased by 14%.
A Limitation: P/E Ratios Ignore Debt and Cash In The Bank
It's important to note that the P/E ratio considers the market capitalization, not the enterprise value. That means it doesn't take debt or cash into account. Theoretically, a business can improve its earnings (and produce a lower P/E in the future) by investing in growth. That means taking on debt (or spending its cash).
Such spending might be good or bad, overall, but the key point here is that you need to look at debt to understand the P/E ratio in context.
Is Debt Impacting First Merchants's P/E?
First Merchants has net debt equal to 36% of its market cap. You'd want to be aware of this fact, but it doesn't bother us.
The Bottom Line On First Merchants's P/E Ratio
First Merchants's P/E is 8.1 which is below average (13.4) in the US market. With only modest debt, it's likely the lack of EPS growth at least partially explains the pessimism implied by the P/E ratio. Given First Merchants's P/E ratio has declined from 12.0 to 8.1 in the last month, we know for sure that the market is more worried about the business today, than it was back then. For those who prefer to invest with the flow of momentum, that might be a bad sign, but for deep value investors this stock might justify some research.
Investors have an opportunity when market expectations about a stock are wrong. If it is underestimating a company, investors can make money by buying and holding the shares until the market corrects itself. So this free visual report on analyst forecasts could hold the key to an excellent investment decision.
But note: First Merchants may not be the best stock to buy. So take a peek at this free list of interesting companies with strong recent earnings growth (and a P/E ratio below 20).
If you spot an error that warrants correction, please contact the editor at editorial-team@simplywallst.com. This article by Simply Wall St is general in nature. It does not constitute a recommendation to buy or sell any stock, and does not take account of your objectives, or your financial situation. Simply Wall St has no position in the stocks mentioned.
We aim to bring you long-term focused research analysis driven by fundamental data. Note that our analysis may not factor in the latest price-sensitive company announcements or qualitative material. Thank you for reading.
