Five Biggest Altcoin Gainer Showcase — June 28—July 5
BeInCrypto breaks down the five biggest altcoin movers and shakers from the previous week. Will their momentum continue?
The five altcoins that increased the most last week were:
Compound (COMP) : 67.50%
XinFin Network (XDC): 67.21%
Ethereum Classic (ETC): 35.39%
Elrond (EGLD): 33.55%
Aave (AAVE): 32.50%
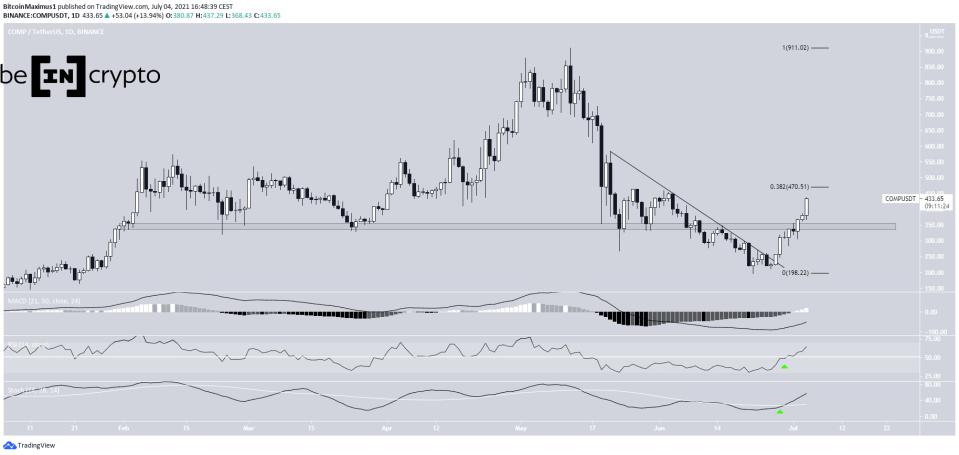
COMP
COMP has been moving upwards since reaching a low of $196.46, on June 22. On June 27, it broke out from a descending resistance line.
Afterwards, on July 1, it reclaimed the $350 horizontal area. This is a significant bullish development since the area has intermittently acted as both support and resistance since January.
Technical indicators are bullish. The Stochastic oscillator has made a bullish cross, the RSI has moved above 50, and the MACD histogram is positive.
The next closest resistance is at $470, the 0.382 Fib retracement level.
XDC
XDC had been following a descending resistance line since it reached a high of $0.137, on April 15. It broke out from this line and simultaneously the $0.075 horizontal area, on June 29.
So far, it has reached a high of $0.125, doing so on July 3. This validated the $0.012 area as resistance, touching it for the third time since April. It has caused a rejection and could potentially initiate a short-term correction.
However, technical indicators are bullish. The RSI has just crossed above 70, the MACD is positive and increasing, while the Stochastic oscillator has made a bullish cross.
Therefore, an eventual breakout is likely.

ETC
ETC has been increasing since reaching a low of $32.17, on June 22. It broke out from a descending resistance line on June 29 and reclaimed the horizontal $50 area the same day.
On July 2, it validated the area as support, creating a higher low in the process.
Technical indicators are bullish, supporting the continuation of the upward movement. The Stochastic oscillator has made a bullish cross. The RSI has moved above 50 and the MACD is nearly positive.
Therefore, an upward move towards the next resistance area at $82 is likely.

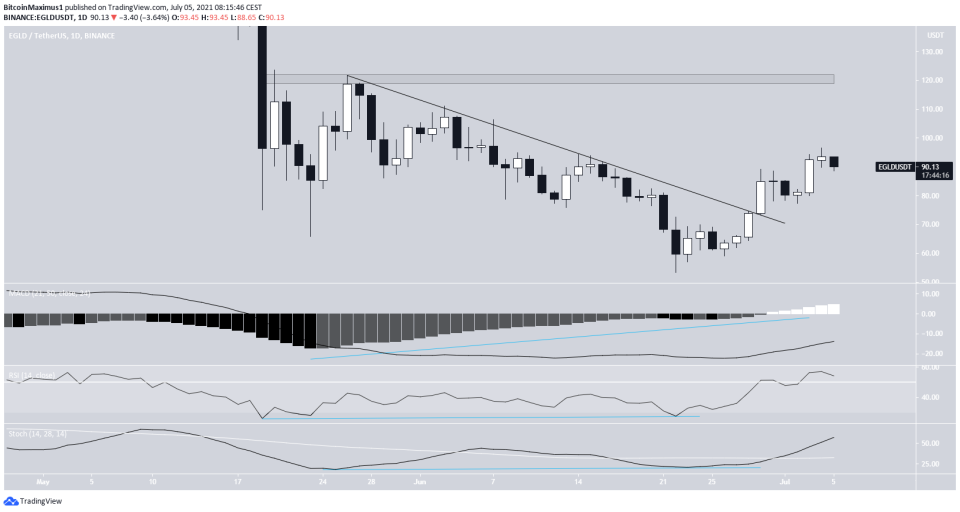
EGLD
Since May 26, EGLD had been following a descending resistance line. It continued doing so until reaching a low of $53.41, on June 22. This created a double bottom pattern, combined with significant bullish divergence.
On June 29, EGLD broke out. It created a higher low, on July 2, and has been moving upwards since.
The closest resistance is at $120.
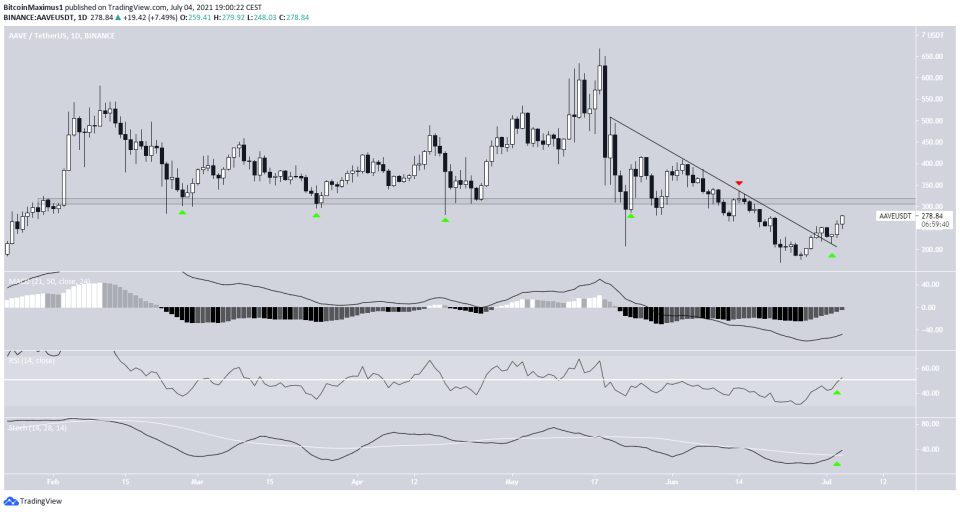
AAVE
AAVE has been moving upwards since June 22, when it reached a low of $170.1. On June 29, it broke out from a descending resistance line and validated it as support afterwards.
Technical indicators are bullish. This is especially visible by the RSI cross above 50 and the bullish cross in the Stochastic oscillator.
However, AAVE is still facing resistance from the $315 horizontal area. The area had acted as support since February, before turning to resistance in June (red icon). Therefore, until it is reclaimed, the trend cannot be considered bullish.
For BeInCrypto’s latest bitcoin (BTC) analysis, click here.
