Flex (FLEX) Q1 Earnings In Line, Revenues Miss Estimates


Shares of Flex Ltd. FLEX declined more than 5% on Jul 27, following the company's not-so-encouraging first-quarter fiscal 2019 results. The company reported first-quarter non-GAAP earnings of 24 cents per share, matching the Zacks Consensus Estimate. Moreover, the figure remained in line with the year-ago quarter.
Revenues increased 6.9% from the year-ago quarter to $6.42 billion. This marked the sixth consecutive quarter of year-over-year revenue growth. However, the figure lagged the Zacks Consensus Estimate of $6.49 billion.
Robust performance across most end markets drove year-over-year revenue growth. The top line benefited from new business wins aided by the Sketch-to-Scale initiative.
Additionally, the company views exploring new emerging markets, including India, as a positive. Further, new bookings from medical group keep management optimistic.
Notably, the company has adopted the new revenue rules of ASC 606 and accordingly incorporated the same while reporting first-quarter results.
Flex anticipates continued development of the long-term strategic partnership with Nike NKE which is likely to lead to profitability.
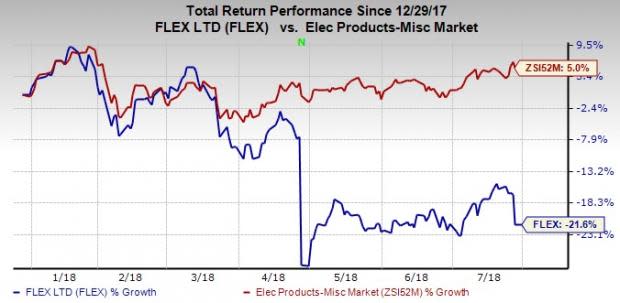
Markedly, the company’s stock has underperformed the industry it belongs to on a year-to-date basis. Shares of Flex have lost 21.6% of its value against the industry’s rally of 5%, primarily due to the loss from Nike venture and unfavourable business mix.
Quarter Highlights
Communications & Enterprise Compute (“CEC”) revenues declined approximately 1% from the year-ago quarter to almost $1.95 billion. Management had anticipated revenues to decline in the range 5-10%.
Legacy-end markets impacted results. However, expansion in cloud data center design capabilities led to better-than-expected results. Notably, the cloud data center offerings witnessed new customer wins, surging 25% on a year-over-year basis.
Consumer Technologies Group (“CTG”) revenues advanced 19.6% from the year-ago quarter to $1.81 billion. Management had anticipated year-over-year growth to be in the range 15-25%.
Robust adoption from emerging markets, particularly India, aided growth. Moreover, management is optimistic regarding improving Nike operations.
Revenues from the Industrial & Emerging Industries (“IEI”) segment were $1.45 billion, improving only4% on a year-over-year basis. Management had anticipated year-over-year growth to be in the range 10-20%.
The segment witnessed a lackluster demand across its diversified markets, including lifestyle, capital equipment, home, component shortages, among others. Adoption of ASC 606 and other energy businesses- related developments reduced revenues by almost $150 million.
High Reliability Solutions (“HRS”) revenues were $1.22 billion, up 7.3% from the year-ago quarter, almost near the lower end of the guided range of 5-15%. The segment comprises medical and automotive group.
Management remains elated on robust bookings record, especially from medical, which garnered around $500 million.
Operating Details
Non-GAAP gross margin contracted 40 basis points (bps) on a year-over-year basis to 6.4% in the quarter. Higher start-up costs, lower operating margins and unfavorable business mix, impacted gross margins.
Non-GAAP selling, general & administrative (“SG&A”) expenses were $225 million, down 3% year over year. Moreover, as a percentage of net sales, SG&A expenses declined 40 bps to 3.5%.
Flex aims to maintain 3-3.2% of SG&A expenses for the rest of the fiscal 2019. Stringent cost-initiatives are aiding the company in this direction.
Non-GAAP operating margin declined roughly 10 bps on a year-over-year basis to 2.9%.Investments pertaining to long-term growth and profitability limit the margin expansion.
Segment wise, CEC generated $46 million in adjusted operating profit and recorded adjusted operating margin of 2.4%, marginally missing the guided range of 2.5-3.5%.
CTG raked in $27 million in adjusted operating profit, resulting in an adjusted operating margin of 1.5%, a tad lower than the guided range of 2-4%.
IEI reported $51 million in adjusted operating profit and 3.6% adjusted operating margin, missing the targeted range of 4-6%.
HRS reported $94 million in adjusted operating profit, resulting in adjusted operating margin of 7.7%, near the higher end of guided range of 6-9%.
Balance Sheet & Cash Flow
As of Jun 29, 2018, cash & cash equivalents were $1.26 billion down from $1.47 billion at the end of the previous quarter. Total debt (long-term plus short term) was $2.92 billion at the end of the quarter.
Flex used net cash from operations of $15 million compared with $323 million generated in the previous quarter. Free cash flow came in at ($185) million compared with $195 million in the previous quarter.
The company was “blacked-out” from share repurchase in the quarter. However, the company intends to resume share buyback to return 50% or more of its annual free cash flow to shareholders.
Notable Developments
Flex recently signed a definite agreement to divest its China-based Multek operation. The divestment deal will result in a payment of approximately $270 million to Flex. The sales proceeds will be utilized toward developing core assets and also strengthen balance sheet. Such asset dropdowns and reduction of debts surely bodes well for its growth.
The company internally developed AutoLab AI from its automation team. It works as an independent company and is a full stack automation solutions provider. The company anticipates AutoLab AI to be a notable growth driver, going forward. Auto AI is anticipated to optimize manufacturing processes through accelerated development of artificial intelligence (“AI”) software and machine learning (“ML”) capabilities.
We believe both the developments augur well in the long term.
Flex Ltd. Price, Consensus and EPS Surprise
Flex Ltd. Price, Consensus and EPS Surprise | Flex Ltd. Quote
Guidance
For second-quarter fiscal 2019, revenues are expected to be in the range of $6.6-$7 billion. The Zacks Consensus Estimate for revenues is $6.95 billion, representing year-over-year growth of 10.8%.
The company expects CEC, CTG, and IEI to grow in the range of 5-10%, 10-15% and 5-10%, respectively, on a year-over-year basis. However, HRS revenues are anticipated to remain almost flat to register growth of up to 5% year over year.
Adjusted operating income is projected in the range of $200-$230 million Moreover, adjusted earnings are expected between 26 cents and 30 cents per share. The Zacks Consensus Estimate for earnings is 28 cents per share, representing year-over-year growth of 3.7%.
For fiscal 2019, Flex anticipates revenues in the range $27-29 billion, and adjusted earnings between $1.2 and $1.3 per share. The fiscal 2019 guidance excludes ASC 606 adjustments.
Notably, the Zacks Consensus Estimate for revenues and earnings for fiscal 2019 are pegged at $28.04 billion and $1.23 per share, respectively.
Flex’s Nike venture is projected to bolster revenues for the rest of the fiscal year.
Conclusion
The company’s CEC business is expected to improve on the back robusta doption of cloud data center products. New customer wins in telecom in relation to 5G demand is projected to boost growth. Further, new programs across emerging markets are expected to propel CTG revenues.
IEI revenues are envisioned to improve primarily due to new program ramps across lifestyle and home verticals. Weakness in energy and capital equipment business is likely to impact the segment marginally.
Medical group is witnessing remarkable bookings. This robust adoption is a key catalyst enabling the company to register impressive fiscal 2020 and fiscal 2021 revenues.
However, stable bookings in automotive are expected to limit HRS growth. Moreover, increasing investments in data center, automation team, among others are likely to limit margins at least in the near term.
Zacks Rank & Stocks to Consider
Flex carries a Zacks Rank #4 (Sell).
Mellanox MLNX and Microsoft MSFT are a couple of stocks worth considering in the broader technology sector, both sporting a Zacks Rank #1 (Strong Buy). You can see the complete list of today’s Zacks #1 Rank stocks here.
Mellanox and Microsoft have a long-term earnings growth rate of 15% and 12.3%, respectively.
Wall Street’s Next Amazon
Zacks EVP Kevin Matras believes this familiar stock has only just begun its climb to become one of the greatest investments of all time. It’s a once-in-a-generation opportunity to invest in pure genius.
Click for details >>
Want the latest recommendations from Zacks Investment Research? Today, you can download 7 Best Stocks for the Next 30 Days. Click to get this free report
Microsoft Corporation (MSFT) : Free Stock Analysis Report
Mellanox Technologies, Ltd. (MLNX) : Free Stock Analysis Report
NIKE, Inc. (NKE) : Free Stock Analysis Report
Flex Ltd. (FLEX) : Free Stock Analysis Report
To read this article on Zacks.com click here.
Zacks Investment Research
