What Is Flexible Solutions International's (NYSEMKT:FSI) P/E Ratio After Its Share Price Tanked?

To the annoyance of some shareholders, Flexible Solutions International (NYSEMKT:FSI) shares are down a considerable 32% in the last month. That drop has capped off a tough year for shareholders, with the share price down 40% in that time.
All else being equal, a share price drop should make a stock more attractive to potential investors. In the long term, share prices tend to follow earnings per share, but in the short term prices bounce around in response to short term factors (which are not always obvious). So, on certain occasions, long term focussed investors try to take advantage of pessimistic expectations to buy shares at a better price. Perhaps the simplest way to get a read on investors' expectations of a business is to look at its Price to Earnings Ratio (PE Ratio). Investors have optimistic expectations of companies with higher P/E ratios, compared to companies with lower P/E ratios.
See our latest analysis for Flexible Solutions International
How Does Flexible Solutions International's P/E Ratio Compare To Its Peers?
Flexible Solutions International has a P/E ratio of 13.77. You can see in the image below that the average P/E (13.7) for companies in the chemicals industry is roughly the same as Flexible Solutions International's P/E.
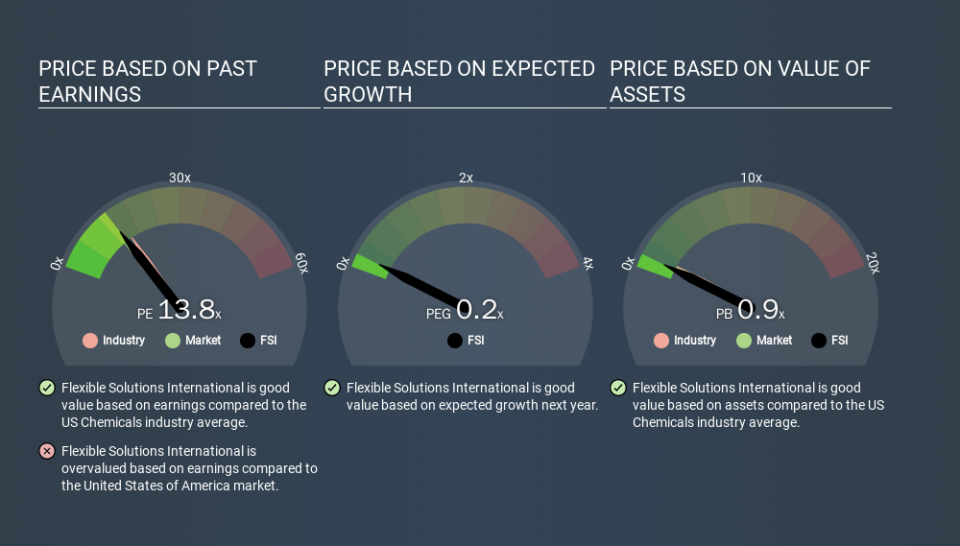
Flexible Solutions International's P/E tells us that market participants think its prospects are roughly in line with its industry. So if Flexible Solutions International actually outperforms its peers going forward, that should be a positive for the share price. Further research into factors such as insider buying and selling, could help you form your own view on whether that is likely.
How Growth Rates Impact P/E Ratios
If earnings fall then in the future the 'E' will be lower. That means unless the share price falls, the P/E will increase in a few years. Then, a higher P/E might scare off shareholders, pushing the share price down.
Flexible Solutions International shrunk earnings per share by 2.5% last year. And it has shrunk its earnings per share by 14% per year over the last five years. So it would be surprising to see a high P/E.
Remember: P/E Ratios Don't Consider The Balance Sheet
It's important to note that the P/E ratio considers the market capitalization, not the enterprise value. Thus, the metric does not reflect cash or debt held by the company. The exact same company would hypothetically deserve a higher P/E ratio if it had a strong balance sheet, than if it had a weak one with lots of debt, because a cashed up company can spend on growth.
Such expenditure might be good or bad, in the long term, but the point here is that the balance sheet is not reflected by this ratio.
So What Does Flexible Solutions International's Balance Sheet Tell Us?
Net debt totals just 5.1% of Flexible Solutions International's market cap. So it doesn't have as many options as it would with net cash, but its debt would not have much of an impact on its P/E ratio.
The Verdict On Flexible Solutions International's P/E Ratio
Flexible Solutions International's P/E is 13.8 which is above average (11.8) in its market. With modest debt but no EPS growth in the last year, it's fair to say the P/E implies some optimism about future earnings, from the market. Given Flexible Solutions International's P/E ratio has declined from 20.3 to 13.8 in the last month, we know for sure that the market is significantly less confident about the business today, than it was back then. For those who don't like to trade against momentum, that could be a warning sign, but a contrarian investor might want to take a closer look.
Investors should be looking to buy stocks that the market is wrong about. If the reality for a company is better than it expects, you can make money by buying and holding for the long term. So this free report on the analyst consensus forecasts could help you make a master move on this stock.
Of course, you might find a fantastic investment by looking at a few good candidates. So take a peek at this free list of companies with modest (or no) debt, trading on a P/E below 20.
If you spot an error that warrants correction, please contact the editor at editorial-team@simplywallst.com. This article by Simply Wall St is general in nature. It does not constitute a recommendation to buy or sell any stock, and does not take account of your objectives, or your financial situation. Simply Wall St has no position in the stocks mentioned.
We aim to bring you long-term focused research analysis driven by fundamental data. Note that our analysis may not factor in the latest price-sensitive company announcements or qualitative material. Thank you for reading.
