Forex Analysis: US Dollar Turns Lower as S&P 500 Hits Four-Month High
THE TAKEAWAY: The US Dollar reversed course lower as the S&P 500 raced upward to a four-month high, sapping demand for the haven-linked benchmark currency.
US DOLLAR TECHNICAL ANALYSIS– Prices broke through support at 10059, the 23.6% Fibonacci retracement. Sellers now aim to challenge the 38.2% level at 9998, with a push below that targeting rising channel support at 9963. The 10059 level has been recast as resistance. A reversal back above that sees channel top resistance at 10133.
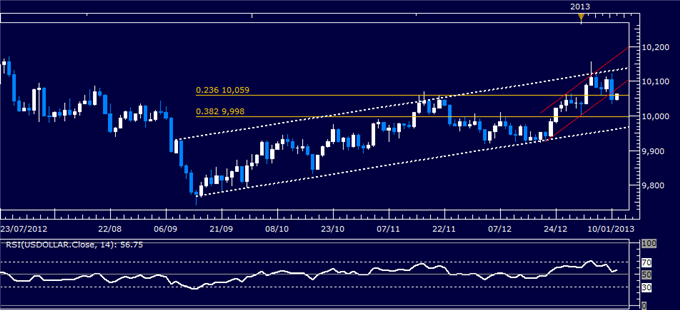
Daily Chart - Created Using FXCM Marketscope 2.0
S&P 500 TECHNICAL ANALYSIS – Prices are testing resistance at 1474.90, the September 14 high. A break above that targets the 100% Fibonacci expansion at 1459.70. Near-term support is at 1466.10, with a turn back below that targeting the 61.8% Fib at 1454.50.
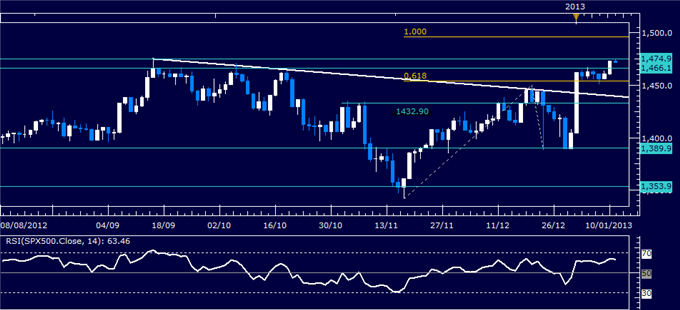
Daily Chart - Created Using FXCM Marketscope 2.0
GOLD TECHNICAL ANALYSIS – Prices bounced from rising trend line support to test the 38.2% Fibonacci retracement at 1674.78. A break above that exposes the 50% level at 1689.95. Trend line support is now at 1648.72.

Daily Chart - Created Using FXCM Marketscope 2.0
Want to learn more about RSI? Watch this Video.
CRUDE OIL TECHNICAL ANALYSIS– Prices took out trend line resistance set from late February, initially exposing the 61.8% Fibonacci retracement at 94.15. A break above that exposes the 76.4% level at 96.54. The trend line (now at 92.96) has been recast as support, with a drop back below that targeting the 50% level at 92.22.

Daily Chart - Created Using FXCM Marketscope 2.0
--- Written by Ilya Spivak, Currency Strategist for Dailyfx.com
To contact Ilya, e-mail ispivak@dailyfx.com. Follow Ilya on Twitter at @IlyaSpivak
To be added to Ilya's e-mail distribution list, please CLICK HERE
DailyFX provides forex news and technical analysis on the trends that influence the global currency markets.
Learn forex trading with a free practice account and trading charts from FXCM.
