Forex: AUD/USD Technical Analysis – 0.93 Figure Under Fire Anew
To receive Ilya's analysis directly via email, please SIGN UP HERE
Talking Points:
AUD/USD Technical Strategy: Flat
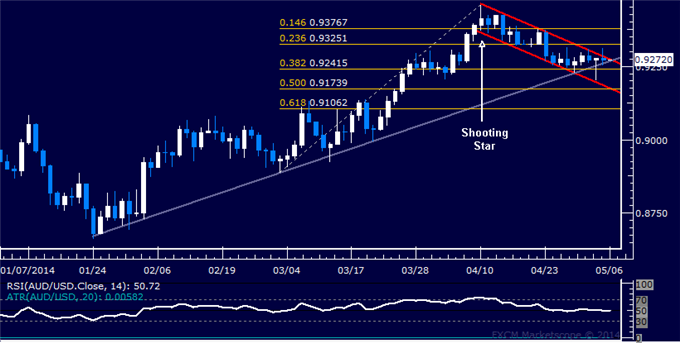
Support: 0.9205 (Apr 3 low), 0.9132 (Mar 7 high, trend line)
Resistance: 0.9303 (Apr 1 high, 23.6% Fib exp.), 0.9363 (38.2% Fib exp.)
The Australian Dollar recoiled upward, producing the largest daily advance in nearly two weeks against its US counterpart. Prices are testing resistance at 0.9303, the 23.6% Fibonacci expansion, with a break above that targeting the 38.2% level at 0.9363. Negative RSI divergence hints at ebbing upside momentum and warns a turn lower may be brewing ahead however. Near-term support is at 0.9205, the April 3 low. A turn below this barrier aims for 0.9132, the intersection of the March 7 high and a rising trend line set from late January.
Risk/reward considerations argue against entering long with prices trading in close proximity to relevant resistance. On the other hand, taking up the short side looks premature absent a defined bearish reversal signal. With that in mind, we will remain flat for now.
Confirm your chart-based trade setups with the Technical Analyzer. New to FX? Start Here!
Daily Chart - Created Using FXCM Marketscope 2.0
--- Written by Ilya Spivak, Currency Strategist for DailyFX.com
DailyFX provides forex news and technical analysis on the trends that influence the global currency markets.
Learn forex trading with a free practice account and trading charts from FXCM.
