Forex: GBP/USD Technical Analysis – A Top Set Above 1.68 Mark?
To receive Ilya's analysis directly via email, please SIGN UP HERE
Talking Points:
GBP/USD Technical Strategy: Flat
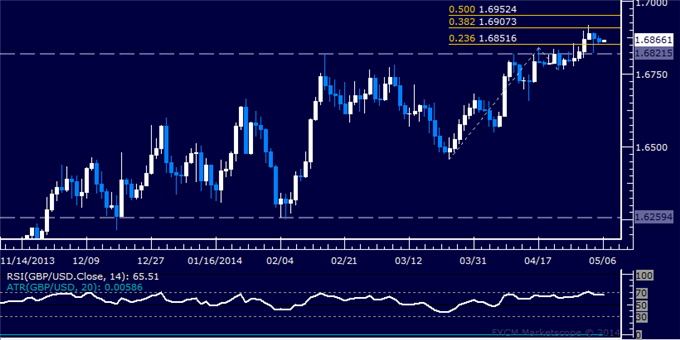
Support: 1.6667-80 (Jan 24 high, 14.6% Fib ret.), 1.6593 (23.6% Fib ret.)
Resistance: 1.6822 (Feb 17 high)
The British Pound may be forming a top against the US Dollar, with prices producing a bearish Evening Star candlestick pattern. Breaking below support in the 1.6667-80 area, marked by the January 24 high and the 14.6% Fibonacci retracement, exposes the 23.6% level at 1.6593. Near-term resistance is at 1.6822, the February 17 swing high.
Taking a short position with prices sitting squarely at relevant support is unattractive from a risk/reward perspective. A clear-cut bullish reversal is absent however, arguing against the long side. We will continue to stand on the sidelines and monitor prices for a palatable setup.
Confirm your chart-based trade setups with the Technical Analyzer. New to FX? Start Here!
Daily Chart - Created Using FXCM Marketscope 2.0
--- Written by Ilya Spivak, Currency Strategist for DailyFX.com
DailyFX provides forex news and technical analysis on the trends that influence the global currency markets.
Learn forex trading with a free practice account and trading charts from FXCM.
