FOREX Technical Analysis: USDOLLAR Former Trendline Support is Now Resistance
Weekly Bars
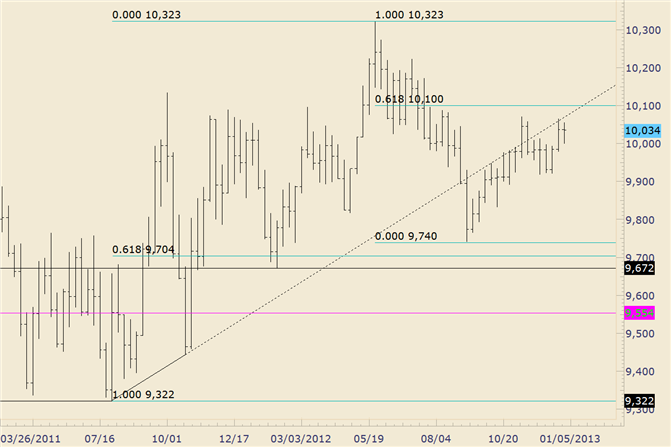
Chart Prepared by Jamie Saettele, CMT
FOREXAnalysis: The USDOLLAR is nearing the top of it’s the range that has been underway since November. Even a move above the November high of 10071 still contends with the 61.8% retracement of the decline from 10323 at 10100 and series of highs from October 2011 to March 2012 from 10100 to 10133.
FOREX Trading Strategy: Flat
LEVELS: 9929 9977 10000 10044 10071 10096
--- Written by Jamie Saettele, CMT, Senior Technical Strategist for DailyFX.com
To contact Jamie e-mail jsaettele@dailyfx.com. Follow me on Twitter for real time updates @JamieSaettele
Subscribe to Jamie Saettele's distribution list in order to receive actionable FX trading strategy delivered to your inbox.
Jamie is the author of Sentiment in the Forex Market.
DailyFX provides forex news and technical analysis on the trends that influence the global currency markets.
Learn forex trading with a free practice account and trading charts from FXCM.
