Forex: USD/JPY Technical Analysis – Topping Below 104.00 Figure?
To receive Ilya's analysis directly via email, please SIGN UP HERE
Talking Points:
USD/JPY Technical Strategy: Flat
Support: 102.65 (23.6% Fib exp.), 101.96 (38.2% Fib exp.)
Resistance:103.75 (Mar 7 high)
The Japanese Yen may be preparing to launch a recovery against the US Dollar after USD/JPY produced a bearish Evening Star candlestick pattern. Near-term support is at 102.65, the 23.6% Fibonacci expansion, with a break below that on a daily closing basis exposing the 38.2% level at 101.96. Near-term resistance is at 103.75, the March 7 high.
Prices are too close to relevant support to justify a short position from a risk/reward perspective, while a viable reversal signal arguing in favor of a long trade is absent. We will remain on the sidelines for now until a more actionable setup presents itself.
Confirm your chart-based trade setups with the Technical Analyzer. New to FX? Start Here!
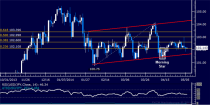
Daily Chart - Created Using FXCM Marketscope 2.0
--- Written by Ilya Spivak, Currency Strategist for DailyFX.com
DailyFX provides forex news and technical analysis on the trends that influence the global currency markets.
Learn forex trading with a free practice account and trading charts from FXCM.
